The S&P 500 and NASDAQ indices hit record highs last week bolstered by rising earnings, a revival in consumer confidence and a strong GDP number for the first three months of this year.
The Commerce Department posted on Friday the first-quarter GDP number (the value of all goods and services produced in the United States adjusted for inflation) coming in at a smashing 3.2%, far exceeding expectations.
This number came out in spite of a government shutdown, uncertainty on trade and concerns about a global slowdown. The first-quarter GDP is usually about 1% below the GDP readings for the rest of the year.
Additionally, incomes continue to grow which translates into more people entering the job market and solid consumer balance sheets. This all bodes well for the economy for the rest of this year.
Against this backdrop, the stock market is fundamentally on solid ground.
However, with the stock market at an all-time high and with trade talk tensions, there will undoubtedly be volatility in the markets.
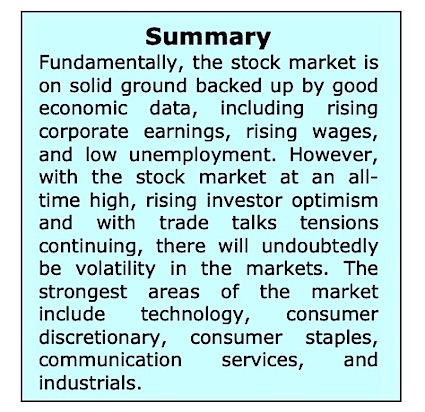
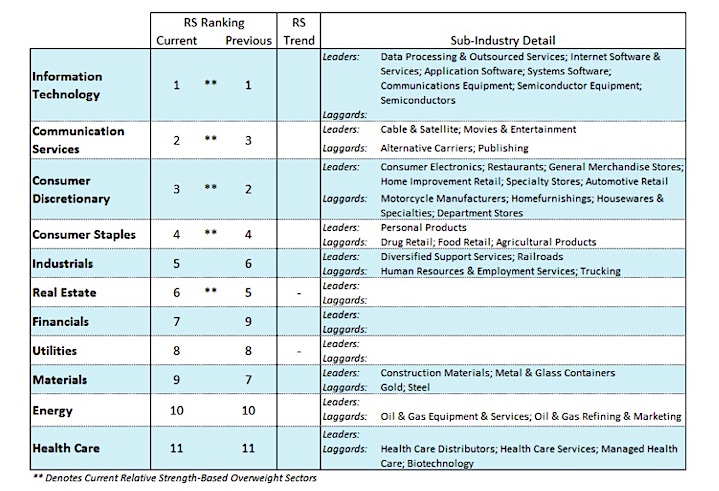
Investors have been richly rewarded this year by staying with the strongest sectors of the market which include technology, consumer discretionary, communication services, consumer staples and industrials.
The technical underpinnings of the market suggest that a near-term pullback/correction cannot be ruled out.
Despite new highs by the S&P 500 and NASDAQ, fewer stocks are participating in the rally. This is seen by the fact that Apple, Amazon, Facebook and Microsoft have contributed nearly 50% of the overall NASDAQ gains in April.
There has been a notable deterioration in the percentage of NASDAQ stocks trading above their 50-day moving average, dropping to just 57% from 80% on March 1.
This is also true for S&P stocks where the percentage trading above their 50-Day moving average has fallen to 72% from 91% two verify months ago. Diverging trends are also seen by the fact that despite the strong rally from the December lows, 50% of S&P 500 stocks are up and 50% are down from their September 2018 peak. The Dow Industrials, Dow Transports, Russell 2000 and NY Composite have yet to confirm the new highs by the S&P and NASDAQ indices.
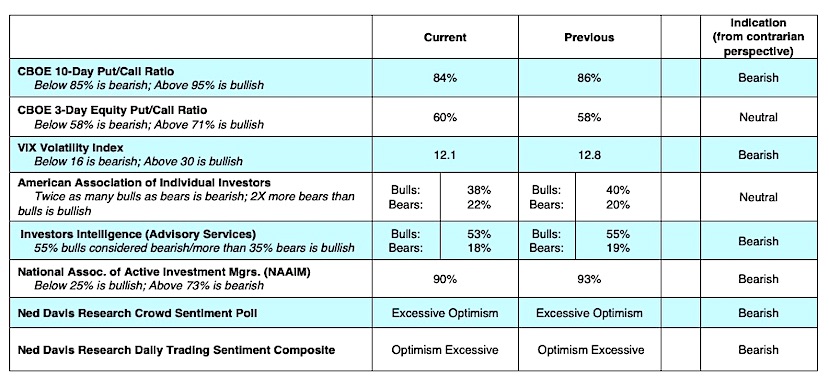
Since the December lows, investor sentiment has reversed from extreme pessimism to excessive optimism in the current example. This is seen by the fact that flows into equity ETFs over the past two months are the strongest since the start of 2018. This increase in the demand for risk assets is echoed by increased complacency evidenced by the drop in the demand for put options (puts are bought in anticipation of stock market decline) and by a drop in the CBOE Volatility Index (VIX) to levels last seen in September 2018. The VIX is a contrary opinion indicator that measures the level of fear or complacency in the markets.
Twitter: @WillieDelwiche
Any opinions expressed herein are solely those of the author, and do not in any way represent the views or opinions of any other person or entity.


