The wave of selling pressure created a sea of red across global equity markets into early March.
Investor fears of the coronavirus outbreak are expanding as the stock market correction plays out.
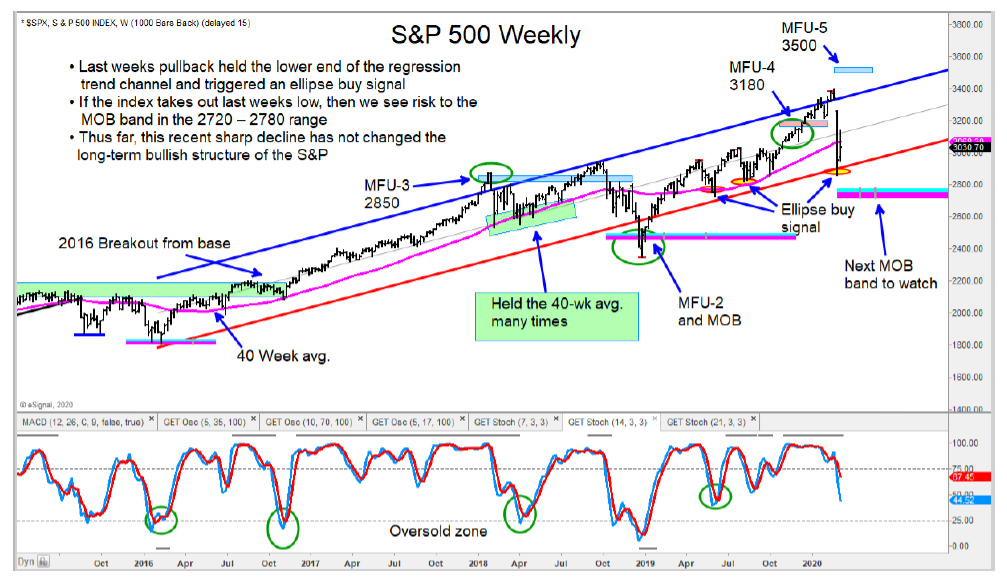
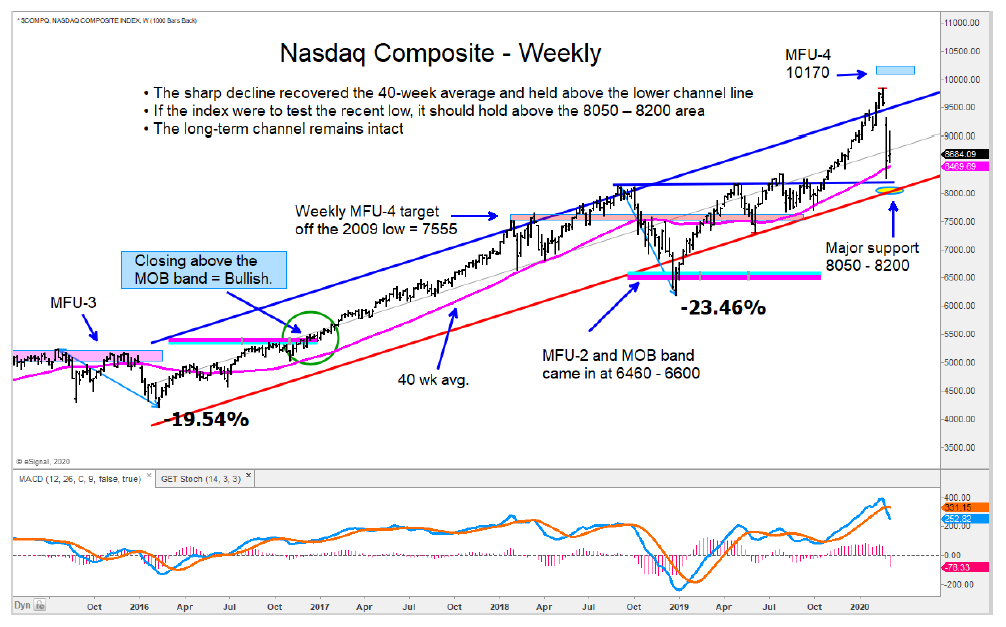
That said, I am sticking with my bullish long-term view for the S&P 500 Index and Nasdaq Composite.
See key stock market correction support levels in the chart below.
S&P 500 “weekly” Chart
Nasdaq Composite “weekly” Chart
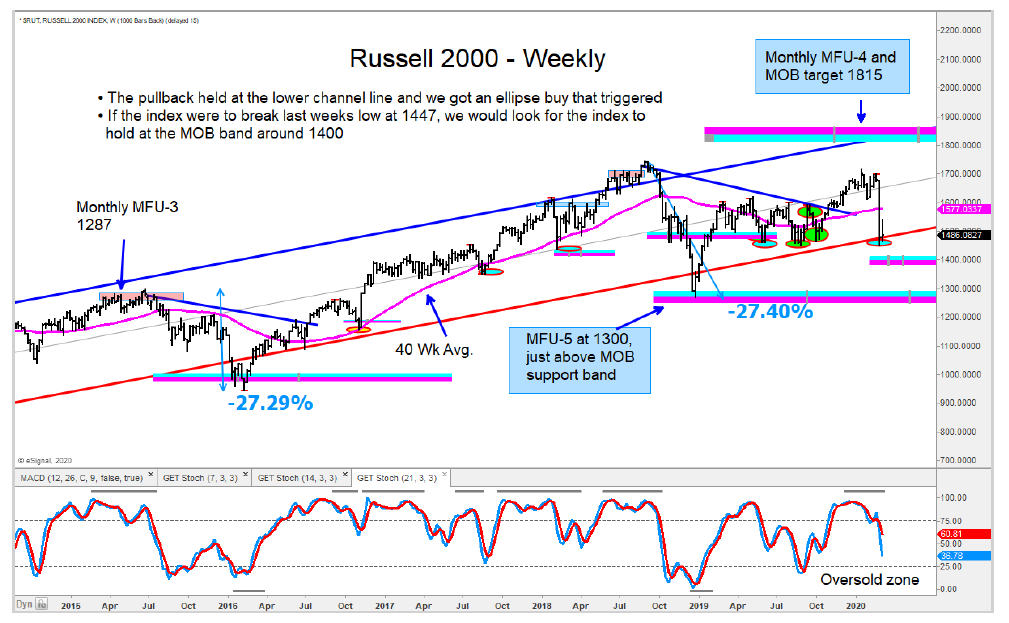
The Russell 2000 and MidCap MDY are both into support zones, which we are monitoring as a line in the sand for them to hold and keep a positive long-term view.
Russell 2000 Index “weekly” Chart
The Dow Transports have broken below the regression trend channel and into a critical support area. We prefer to be on the sidelines for now.
The Dow Utilities pulled back to a support zone and has been able to maintain a solid uptrend off the 2018 low.
We highlighted the iShares Software Sector ETF (IGV) in our February 18 report and noted that it was into our MFU-4 target and we were expecting a pause. The index declined –14% and now into an important support area. On our watch list.
The author may hold positions in mentioned securities at the time of publication. Any opinions expressed herein are solely those of the author, and do not in any way represent the views or opinions of any other person or entity.


