Workers at the bottom of the distribution (the 10thpercentile) have also seen wage growth accelerate in recent years.
This suggests gains in the economy are being more broadly distributed than in the recent past. While the current recovery could soon set a record for duration, it has only been in recently that it has shown the ability to gain momentum and surprise to the upside.
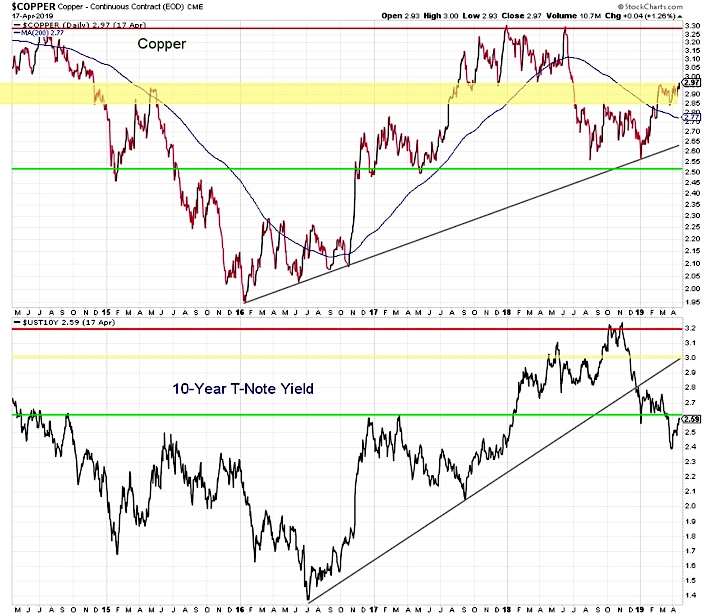
The outlook for the U.S. economy would be strengthened if the global economy could get back in gear. After a brief period of globally synchronized growth emerged in late 2017, the global economy faltered in 2018 even as the U.S. economy remained strong. There are some early signs that global growth may be stabilizing, though at this point conditions are getting less bad rather than actually good. Global export orders have stopped declining though there is little evidence yet that they are increasing. Economically sensitive stock market sectors like Semiconductors have surged to new highs, though the fundamentals in the semiconductor space still appear challenging.
For more confidence that the global economy has turned the corner, we are watching to see if Copper prices can break out to the upside and bond yields drift higher.
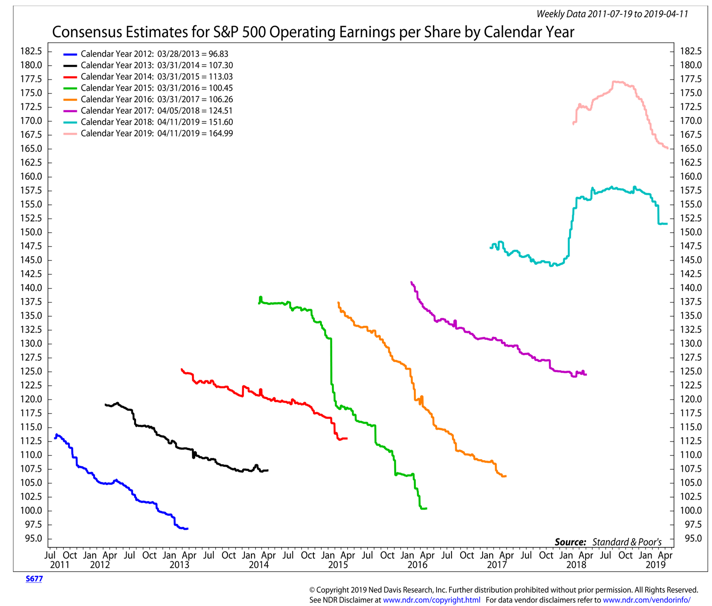
Wage growth can also have impact from corporate earnings perspective, putting pressure on profit margins when earnings growth is already expected to decelerate as the boost from tax cuts fades and global growth remains challenging. The good news is that this being reflected in expectations. Earnings forecasts for the first three quarters of 2019 have moved lower in recent months. Q4 estimates, however, have held steady even as Q4 2018 earnings collapsed (implying 27% earnings growth in Q4 2019). Estimates for 2019 overall may need to fall somewhat further before hitting their bottom.If the global economy does indeed turn the corner later this year, watch for earnings estimates for 2019 (and 2020) to then drift higher in the second half, a trend that has been absent in recent years.
With valuations already stretched from an historical perspective, actual earnings growth will be important fuel for stock market returns.
Economic, monetary and political uncertainties in the first quarter of 2019 may have helped keep a lid on investor sentiment. While various surveys have shown a return in optimism, it has hardly been euphoric. Rather, sentiment, like price has largely been retracing the declines that emerged in the fourth quarter of 2018. This may now be shifting. As March turned to April, data from the NAAIM showed active investment managers turning dramatically more bullish. Inflows to equity ETFs in the first half of April have surpassed their net total for the entire first quarter ($18 billion).
At the current pace, April will see the most inflows to equity ETFs since January 2018. This increased appetite for risky assets is echoed by increased complacency evidenced by a drop in the VIX (now with a 12-handle) and a decline equity put/call ratios. Overall optimism appears to be on its way to moving from elevated to excessive.
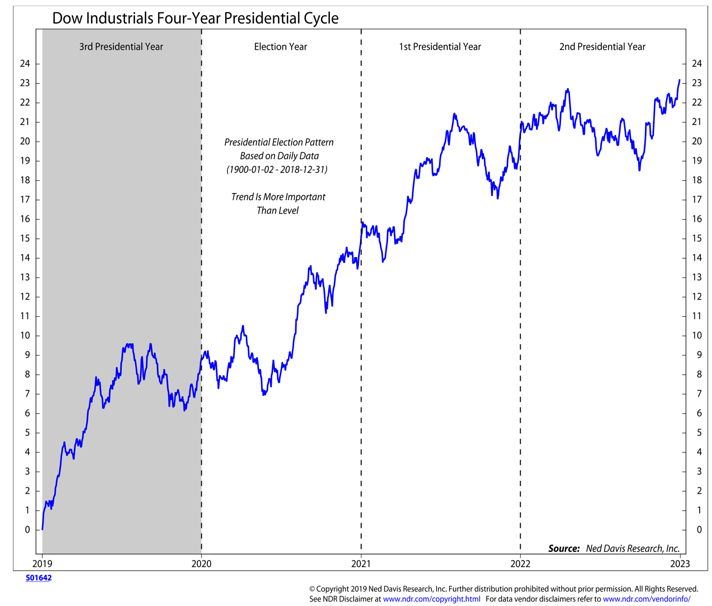
Seasonal patterns have not been particularly reliable of indicators of late. While it is true that the four-year presidential cycle suggested a tailwind for stocks in the first quarter of 2019, from a cycle perspective this would have been building on strength that emerged over the course of the fourth quarter of 2018. That clearly did not happen. Rather than posting the best gains of the entire cycle over the past two quarters, the Dow Industrials and the S&P 500 are roughly flat.We have been wary of putting much weight on the seasonal patterns right now because the evidence has not supported it. In the past, seasonal stock market strength in the wake of mid-term elections has been characterized by small-cap leadership. That has not materialized in the current example. Even if there are residual seasonal tailwinds in play right now, they could expire as we move toward mid-year.
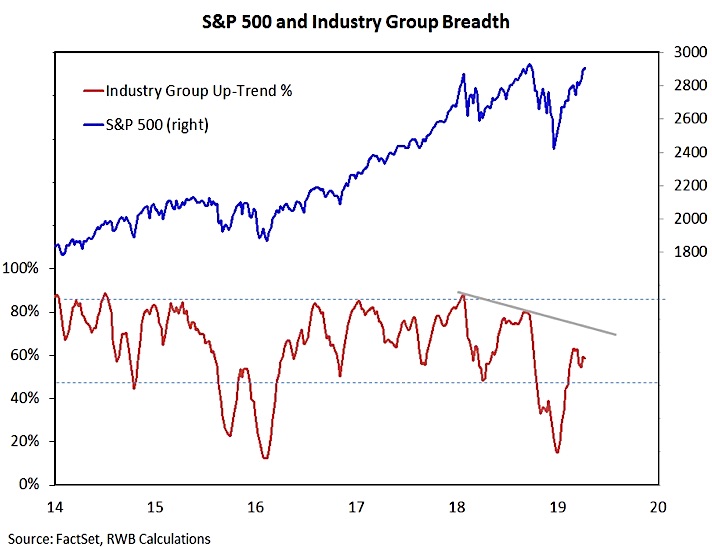
The move in the S&P 500 since bottoming in late 2018 has been impressive, and the emergence of breadth thrusts in early 2019 has been encouraging. Our breadth indicators, particularly those that look at longer-term trends, have struggled to endorse the index-led rally. Our industry group trend indicator followed the first leg of the S&P 500 rally, higher but since March it has stalled even as the S&P 500 continued to climb.For now, the pattern of lower highs that emerged in 2018 remains intact. We don’t want to over-read signals from this indicator (currently 59%), but are watching for either a break above the early March high (63%) or below the late March low (54%).
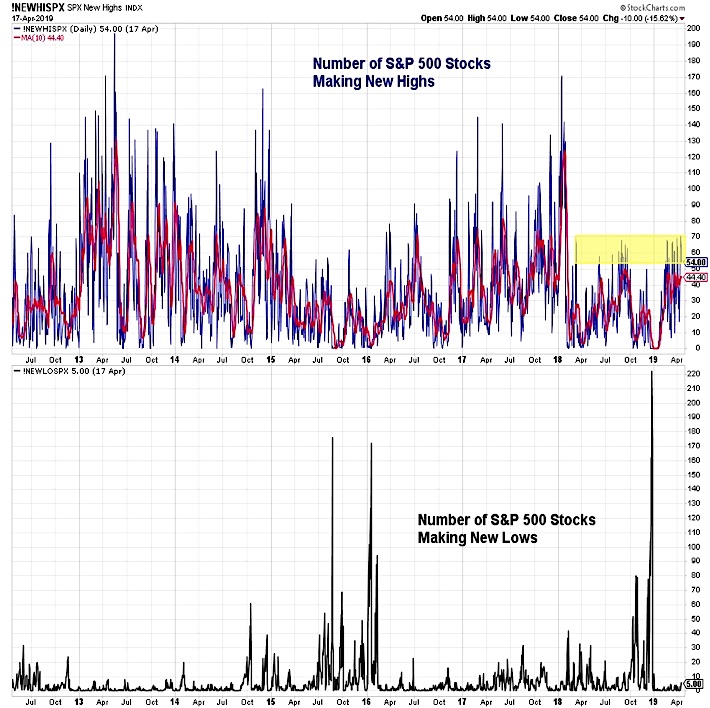
Even with the S&P 500 itself, rally participation has been mixed. We have been encouraged that the percentage of stocks trading above their 200-day averages has expanded (from 55% to 70%) with the most recent gains in the index. Still missing, however, is a notable expansion in the new high list. Since the January 2018 peak, the daily new high list on the S&P 500 has been capped between 50 and 70 stocks.
The failure of this range to expand higher is not consistent with past experiences coming out of cyclical bull markets. Similarly, the weekly new high list for the NYSE + NASDAQ has stalled over the past six weeks and remains shy of the descending peaks that emerged over the first three quarters of 2018. The relative lack of individual stocks moving to new 52-week highs argues against taking a more bullish view on equities, suggesting that near-term consolidation/pullback may be a higher likelihood outcome than a new leg higher. Without an expansion in the new low list, any pullback that does emerge is likely to be limited in degree.
Twitter: @WillieDelwiche
Any opinions expressed herein are solely those of the author, and do not in any way represent the views or opinions of any other person or entity.


 Ready To Break Out?")

 Rolling Over At Key Fibonacci Level?")
")
