Key Takeaway: The US Dollar uptrend has stalled, turning what had been a headwind for the economy in 2015 into a potential tailwind in 2016. US Dollar trends are showing weakness and this could help fuel a rebound in earnings growth, helping relieve still-high valuations.
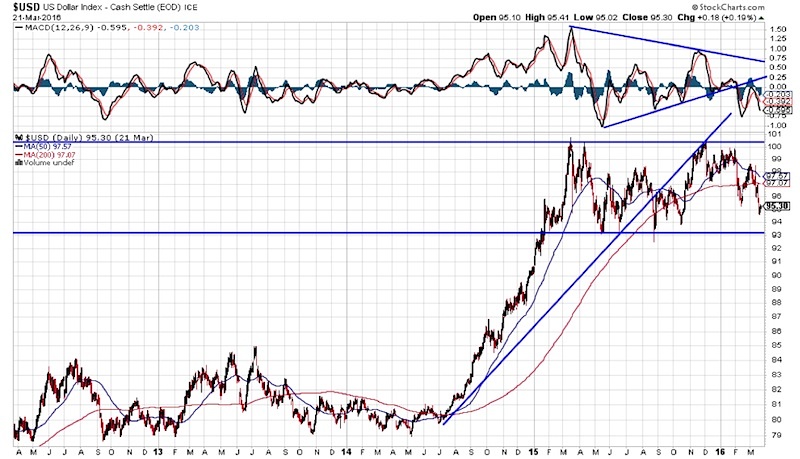
While it was a story (and corporate excuse) for much of 2015, the rally in the US dollar began in earnest in the second half of 2014 and the peak (as of now) was in place by the end of the first quarter of last year. During that time period, the US Dollar index rallied 25%.
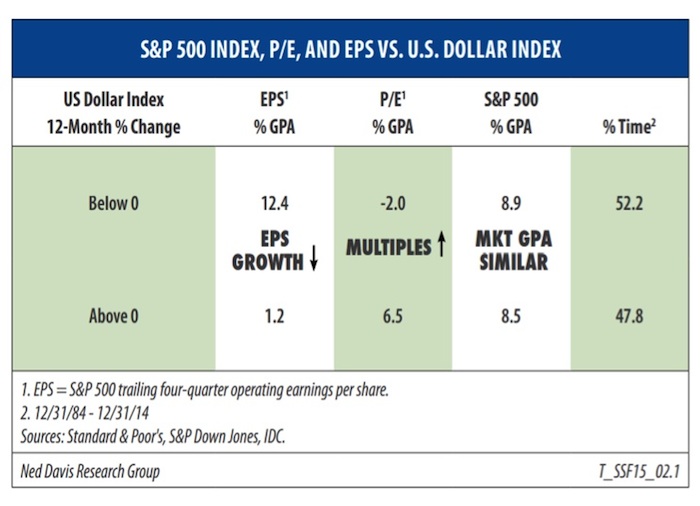
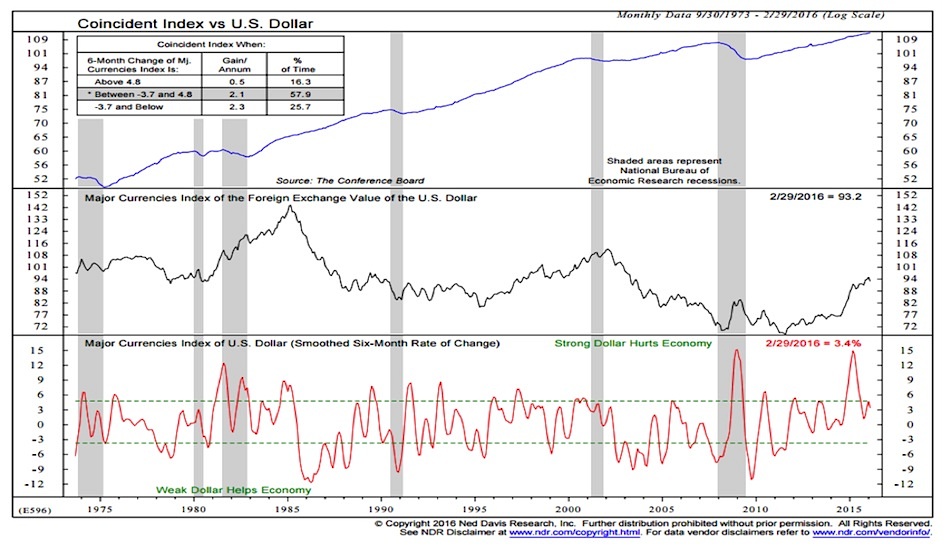
But for the past year, the dollar has moved sideways within a broad trading range as the momentum trend has deteriorated. The 200-day average has flattened out, and soon the 50-day average could cross below the 200-day. Looking at the price chart (below), it is becoming harder to make the case that US Dollar trends are still pointing higher. The year-over-year change in the US Dollar moves is now at or below zero, providing a bullish tailwind for the economy overall and especially corporate earnings. Improved corporate fundamentals could help relieve still-elevated valuations (from the perspective of Price/Earnings ratios, this would mean a lower P/E due to a higher E rather than just a lower P – a welcome development for most investors).
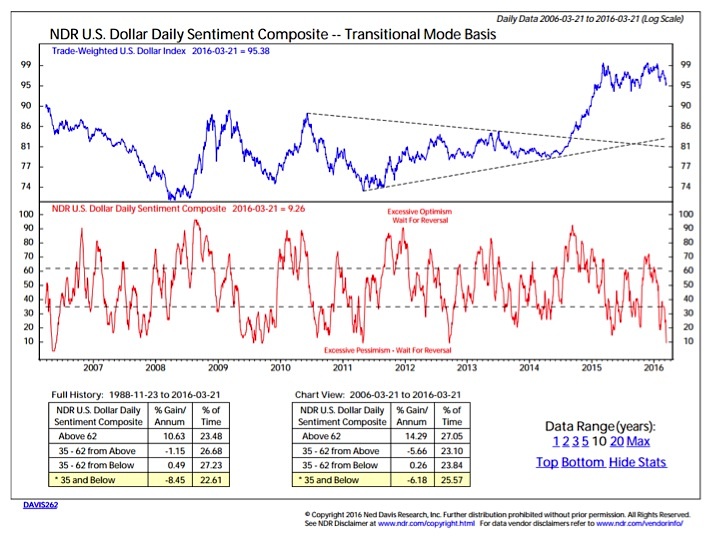
Sentiment on the dollar has soured recently – from excessive optimism seen in late 2015 as the Fed raised rates, to now excessive pessimism following a more dovish view on monetary policy following the most recent FOMC meeting. Importantly, sentiment does not turn bullish for the dollar until there is clear evidence of optimism. The dollar has tended to continue to weaken when investors have been pessimistic.
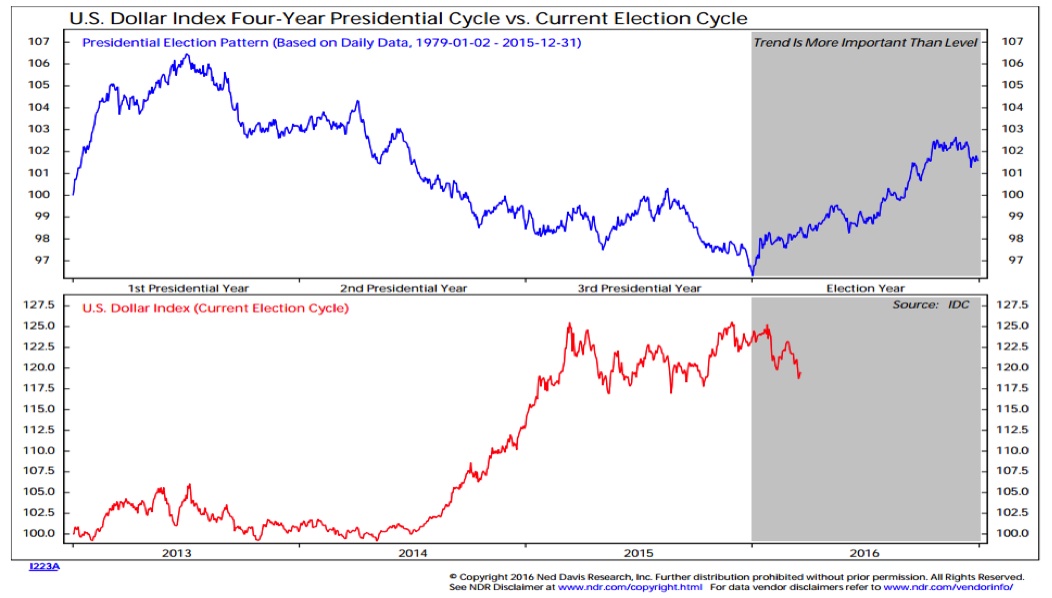
Seasonal patterns overall have suffered a bad rap of late. Expected seasonal strength for stocks in 2015 did not materialize. The dollar has not really ignored seasonal tendencies over the past several years, but rather moved in the opposite direction of what would have been expected based on history. In that vein, the historical strength seen from the dollar in election years could mean further weakness for the dollar in 2016.
Dollar strength (from the perspective of a positive 12-month change) has historically been a headwind for earnings growth, and that certainly seemed to be the case in 2015. But now, as the yearly change moves to or below zero, earnings could benefit from a currency tailwind. Rather than lower EPS growth and higher multiples, we could see better earnings growth and lower multiples for 2016. While not necessarily helping stocks rally, this would provide important fundamental improvement for the market.
The benefit is not just limited to currency effects in corporate earnings. Strength in the dollar saps overall economic growth. With the dollar up-trend stalling, the six-month change in the dollar is now more conducive to better growth and (not shown here) a modest uptick in inflation.
Thanks for reading.
Further reading from Willie: “Weekly Stock Market Outlook: Breadth, Sentiment Improve“
Twitter: @WillieDelwiche
Any opinions expressed herein are solely those of the author, and do not in any way represent the views or opinions of any other person or entity.


