Here’s a look at some key stock market indicators, charts, and themes that we are watching.
This Week’s Stock Market Outlook:
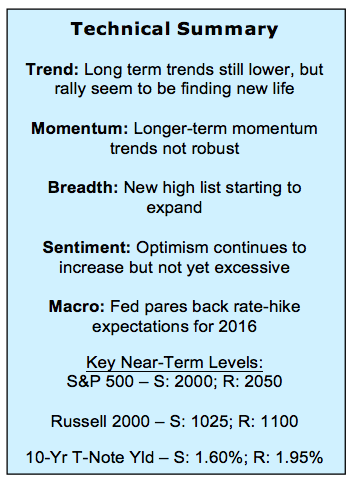
Market Trends Prove Themselves Through Resiliency – After looking tired last week, the rally off of the February lows has proven resilient, bringing the S&P 500 and the Dow Industrials into positive territory for 2016. As strong as this move has been, however, the longer-term trends, as identified by lower highs and lower lows, remain intact.
Will Going Green YTD Bring a Surge in Optimism – Rising optimism has been fuel for the rally after the emergence of excessive pessimism in February. While getting closer to excessive optimism, we are not there yet. Getting into positive territory for 2016 and any investor relief that comes with that, could push sentiment over the edge.
Breadth Gains Starting to Accumulate – Long-term breadth trends remain poor. Even with this week’s rally it appears that no more than half of the industry groups in the S&P 1500 will be in up trends. Nonetheless, we are seeing improvements in other breadth indicators – improvements that were notably absent as stocks rallied in the fourth quarter of 2015.
Stock Market Indicators – Indices & Sectors (click to enlarge)
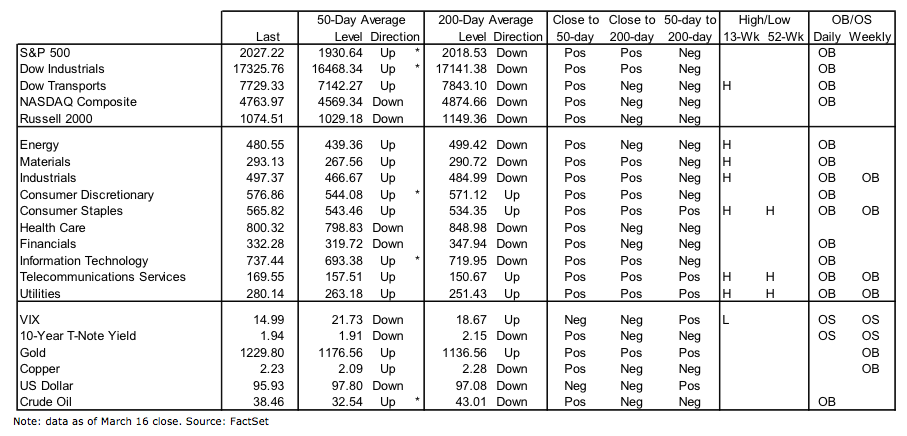
S&P 500 Index
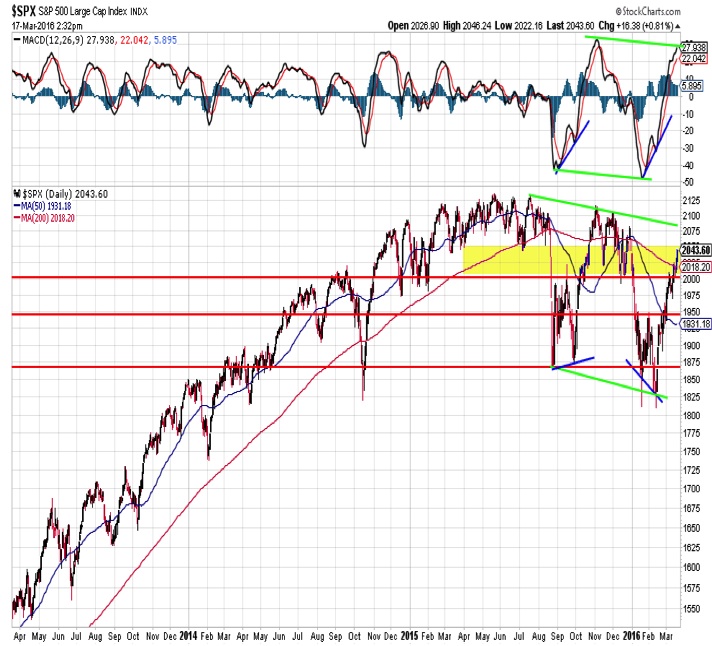
The short-term trend on the S&P 500 has proven resilient as the index has moved into positive YTD territory for the first time in 2016. But from a longer-term perspective, the highs seen in November 2015 were lower than the mid-year highs, and the lows seen in 2016 were lower than the August 2015 low. In other words, as strong as the rally off of the February lows has been, the longer-term down-trend is still intact. A break above 2050 could lead to a test of that down-trend near 2075. Support is near 2000 and then at 1950.
Investor Sentiment
Optimism has increased as the rally has unfolded, but it remains shy of being excessive. This week’s AAII survey actually showed a slight up-tick in bearish sentiment (from 24% to 27%), while bulls contracted from 37% to 30%. The Investors Intelligence data moved in the opposite direction – bulls rose for the fifth week in a row and are now at 44% (from 39% last week). Bears fell from 35% to 30%. The NAAIM exposure index (shown to the left) increased from 51% to 63% but is shy of the peak exposure seen last fall (70%).
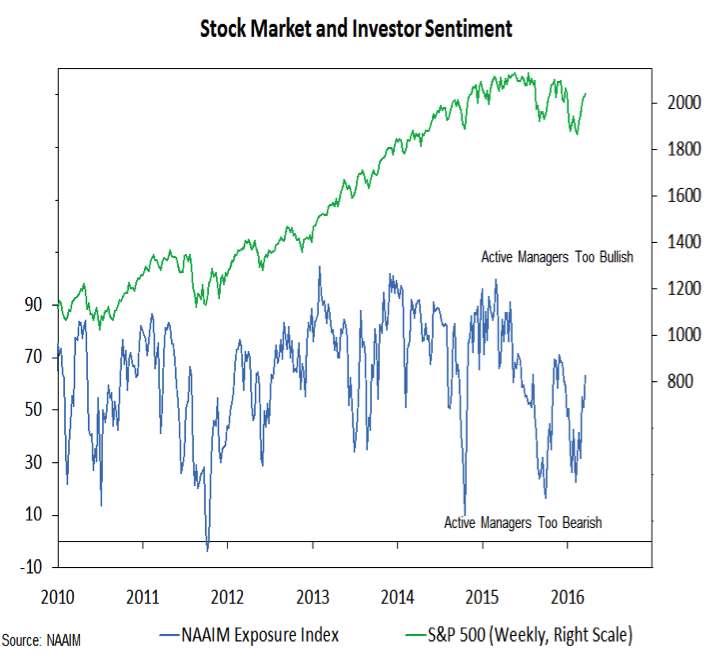
Individual sentiment indicators can send conflicting signals at times, and so a composite indicator can be useful. The NDR Trading Sentiment Composite is on the cusp of signaling excessive optimism. This could indicate that the rally off of the February lows could soon find further gains to be more hard fought. While peaks in this indicator have usually been well above the current level, the peak prior to last summer’s sell-off was just barely above the excessive optimism threshold.

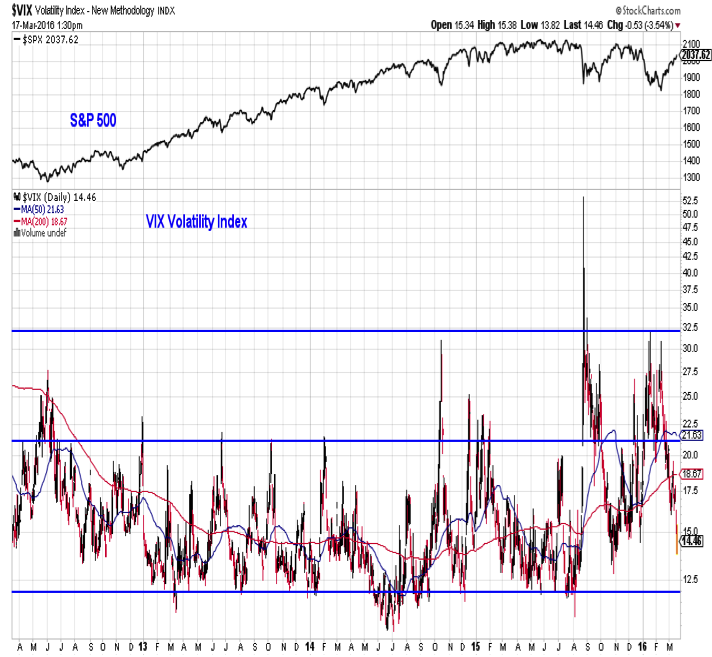
As the rally in stocks has unfolded, the VIX has plummeted (with 10 trading days to go in the first quarter, the S&P 500 is flat YTD and the VIX is below 15 – a nice quiet start to the year it might seem). While this seems to indicate undue complacency and a lack of fear, according to Charlie Bilello (@MktOutperform) this represents the largest 5-week decline in the VIX on record, and could actually have bullish implications for stocks.
continue reading on the next page…


