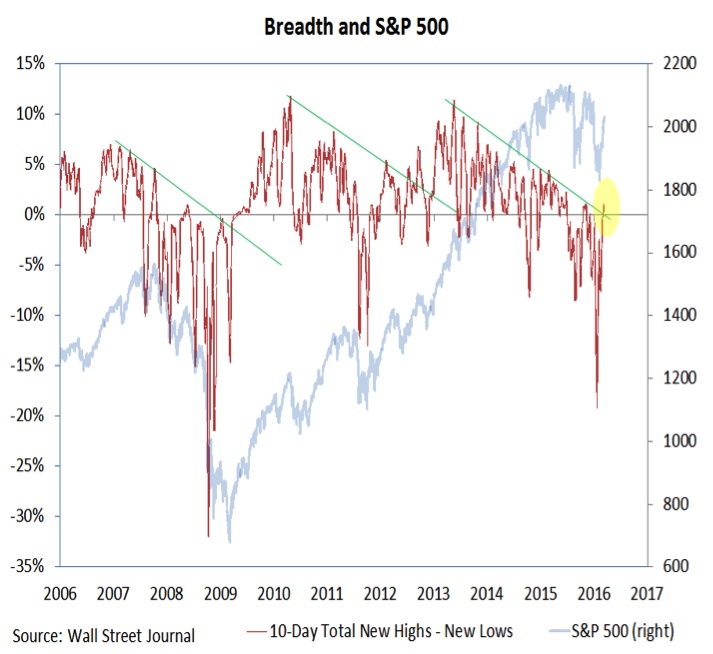
Market Breadth Indicators
Another measure of the resiliency of the rally is its ability to bring in broad participation. In other words, a short-term rally that persists long enough to see breadth gains can morph into a longer-term price move. It is too early to draw that conclusion, but the evidence is moving in that direction. Missing from the Q4 2015 rally was a notable expansion in the issues making new highs. That appears to be changing. On a single-day basis, we are seeing the most new highs on the NYSE since June of last year.
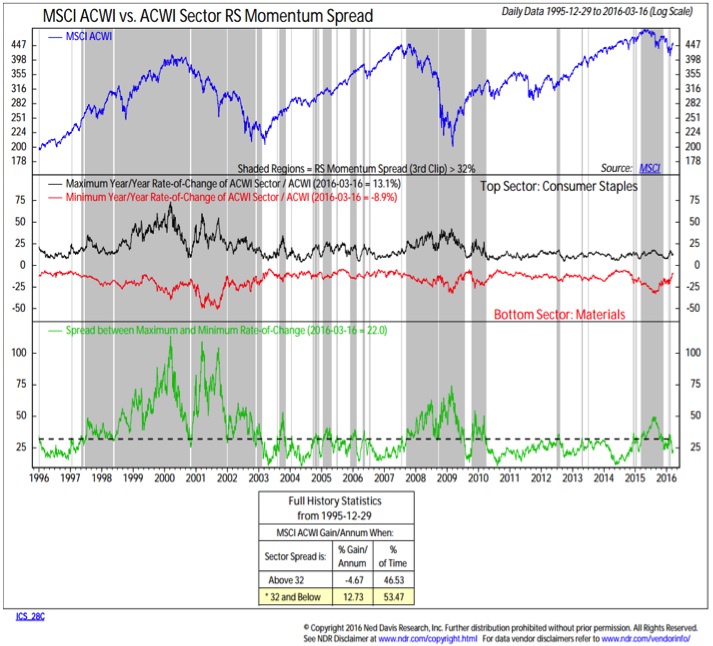
This rally has also seen participation by the lagging sectors – to the point that the spread between the best performing and worst performing sectors has narrowed considerably. This spread is now in bullish territory for the stock market overall. Again, this narrowing did not take place when the stock market rallied in the fourth quarter of 2015.
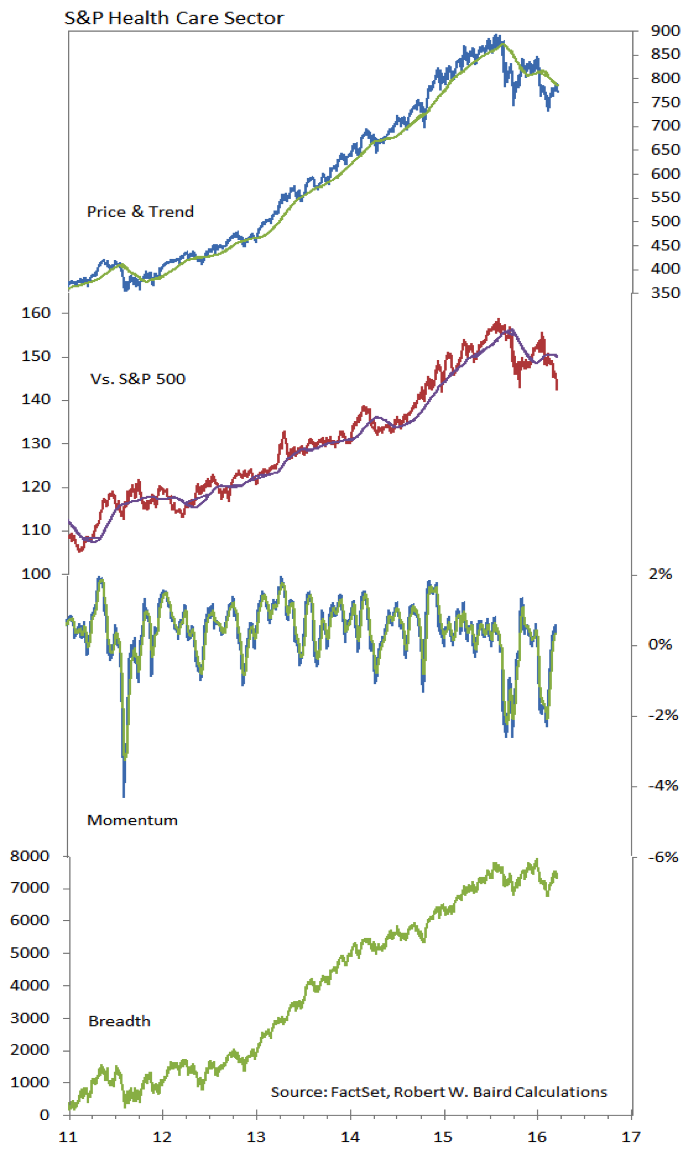
Health Care Sector
While a lot of attention is paid to lagging sectors playing catch-up, we have also seen a marked deterioration in one of the recent leaders. Last summer, Health Care was the top-ranked sector in our relative strength work and was working on fifth consecutive year of relative outperformance. Since that mid-year peak, the sector has made a lower high and a lower low on both a relative and absolute price basis. For 2016, Health Care is the worst performing sector in the S&P 500 and the longer-term relative price up-trend line is being challenged.
Thanks for reading this week’s stock market outlook. Have a great weekend.
Twitter: @WillieDelwiche
Any opinions expressed herein are solely those of the author, and do not in any way represent the views or opinions of any other person or entity.


 May Tip Stock Market’s Next Move")


