In addition to watching the price of a specific asset, it’s important to monitor other indicators as well.
For precious metals and gold bugs, the U.S. Dollar Index and Dollar based ratios can be helpful.
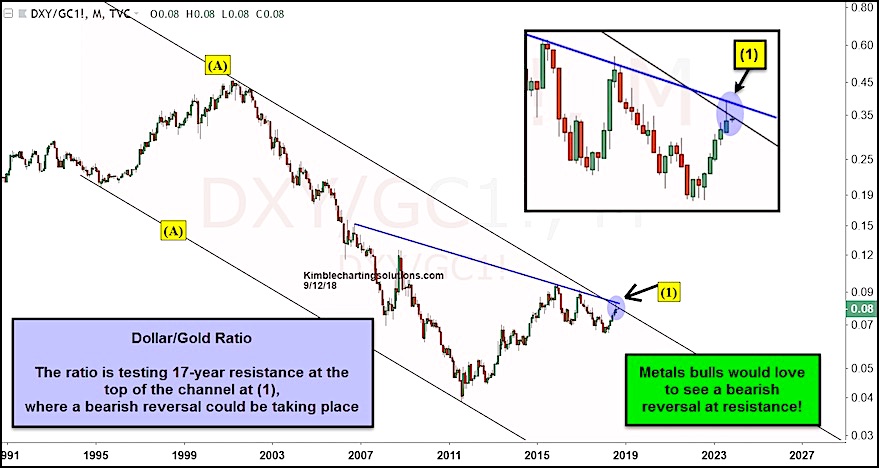
Today, we re-visit the ratio of the U.S. Dollar Index to Gold. When the Dollar is stronger than the price of Gold, the ratio moves higher… and when the Dollar is weaker than gold it moves lower.
Gold bugs and bulls like to see this ratio move lower.
The ratio has been moving in a wide declining channel for 17 years (point A). That said, it’s been rallying higher for the past 7 years, making it hard on the precious metals sector.
But the ratio has recently bumped up against the upper channel resistance, where a bearish reversal may be taking place! Metals bulls would love to see the 17-year channel resistance hold at (1)… and lead to a move lower.
Gold bulls want/need this to hold!!! If the ratio would breakout to the upside, it would send a strong bearish message to Gold bugs.
U.S. Dollar Index to Gold Price Ratio Chart
Note that KimbleCharting is offering a 30 day Free trial to See It Market readers. Just send me an email to services@kimblechartingsolutions.com for details to get set up.
Twitter: @KimbleCharting
Any opinions expressed herein are solely those of the author, and do not in any way represent the views or opinions of any other person or entity.


