Recent weakness in the US Dollar has helped to propel commodities such as Gold and Silver higher.
Today’s analysis showing a potential repeating pattern that could mean significantly more weakness for King Dollar… but only if triggered.
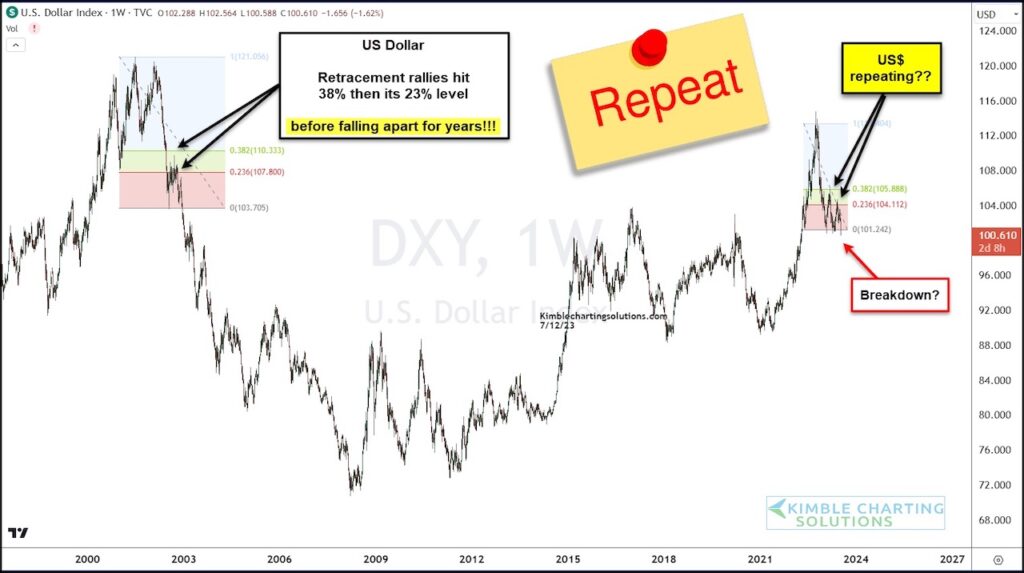
Below is a “weekly” chart of the US Dollar Index dating back 25 years. As you can see, the meltdown in the early 2000’s started with a key Fibonacci patterned decline… one that looks awfully familiar to the recent price action for the buck.
First, the Dollar fell sharply. Then it rallied to the 38.2% Fibonacci retracement (resistance), before falling again and weakly rallying to the 23% Fib level and failing. What happened next (in the early 2000’s) was a big time decline.
This pattern is playing out again for King Dollar this year. Could it be deja vu all over again? If the buck breaks down through support, it will signal further weakness. Stay tuned!
US Dollar Index “weekly” Chart
Note that KimbleCharting is offering a 2 week Free trial to See It Market readers. Just send me an email to services@kimblechartingsolutions.com for details to get set up.
Twitter: @KimbleCharting
Any opinions expressed herein are solely those of the author, and do not in any way represent the views or opinions of any other person or entity.


