For this self-avowed corn trader of nearly 16-years, the last 20-months in this barren wasteland of a market have been anything but prolific. Nearly every trading session has left me with the uninvited, yet distinct aftertaste of utter indifference. The corn market has read like a 21st century rendering of Milton’s Paradise Lost for those of us fortunate enough to feast on the forbidden fruit of $7 and $8 corn prices in 2008, 2011, 2012, and 2013.
In fact over a period of 5 ½ years (1/1/2008 – 6/30/2014) front-month CME corn futures AVERAGED $5.41 per bushel.
Prior to 2008, the last time corn futures EVER traded above $5.00 was in 1996. However since then (7/1/2014 – 2/27/2016) average futures corn prices have fallen to just $3.72 per bushel, representing more than a 30% decline in value.
Just how bad is it? Last week I had a corn producer call me celebrating a 4 ¾-cent per bushel higher WEEKLY close in corn futures. His exact comment was “another week like this and we might actually make money this year.” Oh how the mighty have fallen.
I know I’m not alone in looking back at the Steroid Era in corn prices with pure nostalgia. Major League Baseball had Barry Bonds…the corn market had the 2008 Financial Crisis. That said the present reality is whether you’re a producer, an end user, or a spec it takes price volatility to create both opportunity and margin. Those daily trading limit, 40-cent moves in corn futures certainly led to some sleepless nights no doubt; however the alternative has since proven itself an equally debilitating and mind-numbing adversary. My apologies to Dodd and his buddy Frank but if the choice is now between driving a mini-van, shrink wrapped in airbags and 5-Star Safety Ratings, or a Ferrari on the Autobahn with suspect breaks, give me the sports car.
The following is the SUM of the corn market opportunity thus far in 2016:
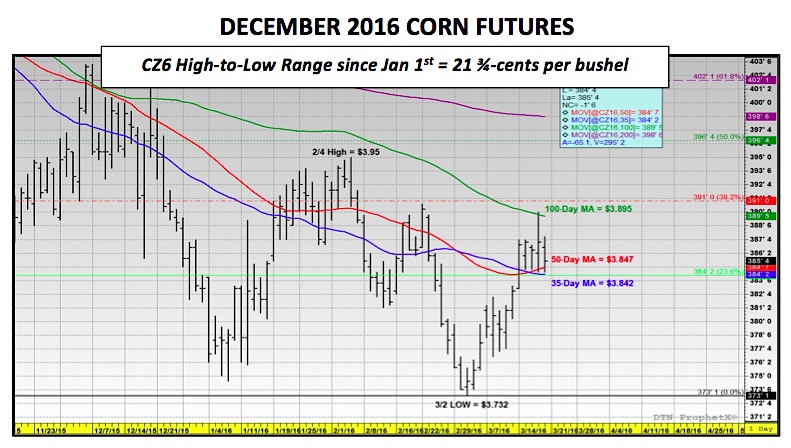
- As of the 1st trading day of January 2016 the price action in December corn futures through the market close on 3/14/2016 has been almost entirely sideways. The CZ6 futures close on 1/4/2016 was $3.77 per bushel. On 3/14/2016 CZ6 closed at $3.87, just 10-cents higher versus the beginning of the year.
- The high-to-low trading range over that same window of time has also been incredible narrow. It’s consisted of the CZ6 day high of $3.95 on 2/4/2016 versus the day low of $3.73 ¼ on 3/2/2016. That equates to a TOTAL December corn futures trading range of just 21 ¾-cents over the first 2 ½ months of 2016!
Therefore the question then becomes how do you trade a market successfully that doesn’t essentially go anywhere and at price levels that don’t insure even a positive margin? I have two schools of thought on this; however neither of them have proven all that appealing to me at the moment.
- If you’re confident the corn market is range bound due to Bearish fundamentals and/or the lack of any major upcoming pricing uncertainties (i.e. spring planting delays, pollination temperature concerns) I’ve always looked at selling call/put strangles at the strike prices I’ve identified as the Min/Max parameters of the trading window. The goal being to collapse and collect the option premium at expiration, assuming the market stays within those defined parameters while still controlling on a daily basis the position’s net Delta risk as best as possible. What’s the problem with that strategy in the current market environment? Option volatility is predominantly trading at less than 20-22% (May and July corn options) and historically speaking that’s not something you want to risk selling even in a market that appears to be going nowhere. The possibility of an unexpected jump in option volatility can quickly extinguish any premium you were hoping to collapse in less than a trading session. For this reason alone I’m struggling to find the right call/put combination that meets my acceptable criteria as far as strike price, option premium, implied volatility, and days-to-expiration are concerned.
- Based then in part by what I just alluded to regarding current option volatility being too cheap to sell, the next logical step then is to consider buying options if the derivative components are suggesting they are underpriced. However what’s the dilemma of buying a front-month, at-the-money call or put option? As of the May corn futures close of $3.68 ¼ on 3/16/2016 a May 370 call was valued at 8-cents per bushel. The May 370 put premium was 9 ¾-cents per bushel. Both options had an implied volatility of approximately 19%. Therefore from strictly a volatility perspective, both the May 370 call and/or put options offered the impression of being a relatively good buy. However, once again, considering the corn prices have been confined to a 20 to 22-cent trading range since January 1st I still wasn’t able to justify paying nearly a dime for the opportunity to theoretically make 10 or 12-cents per bushel (assuming that range continued to hold and the market moved in the direction I had anticipated).
The other consideration specifically for May options is they expire in just over 30-days. Therefore if the extrinsic value of the call or put isn’t comprised of significant volatility, the option premium is likely weighted disproportionately to its remaining time value. Time value erosion accelerates considerably when options move to within 30-days of expiration. That said if the market continued to move sideways (as has been the case in 2016), the extrinsic value of the option would likely decay fairly quickly and the probability of that option expiring worthless would increase substantially. Therefore a call or put option that looks economical can still prove costly over time if the investment requires 8 to 10-cents per bushel in premiums in narrow, range bound markets.
What’s the answer then to trading successfully in this type of market?
Experience, patience, timing, execution, and let’s be honest…a little bit of luck.
CURRENT CORN PRICES & EXPECTATIONS:
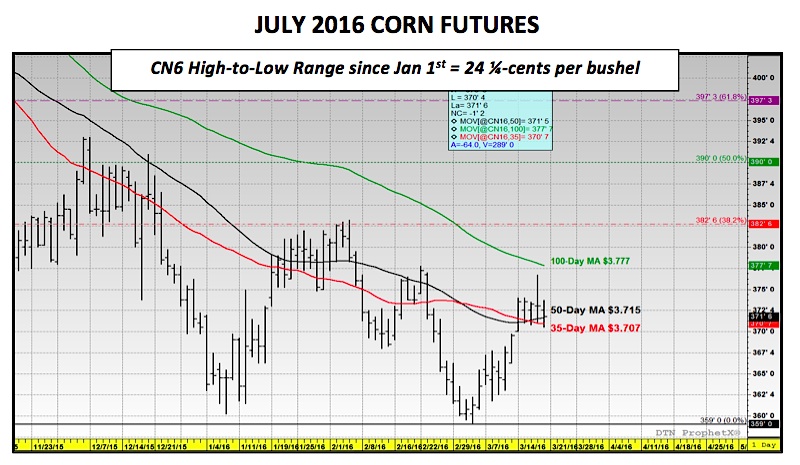
Looking specifically at December corn futures, Thursday CZ6 made a valiant attempt at pushing through the 100-day moving average of $3.896 by posting a day high of $3.90; however ultimately prices faded at the close, settling back under that key resistance level. Friday’s 1 ¾-cent per bushel lower close of $3.85 ½ was considered a further disappointment for Corn Bulls.
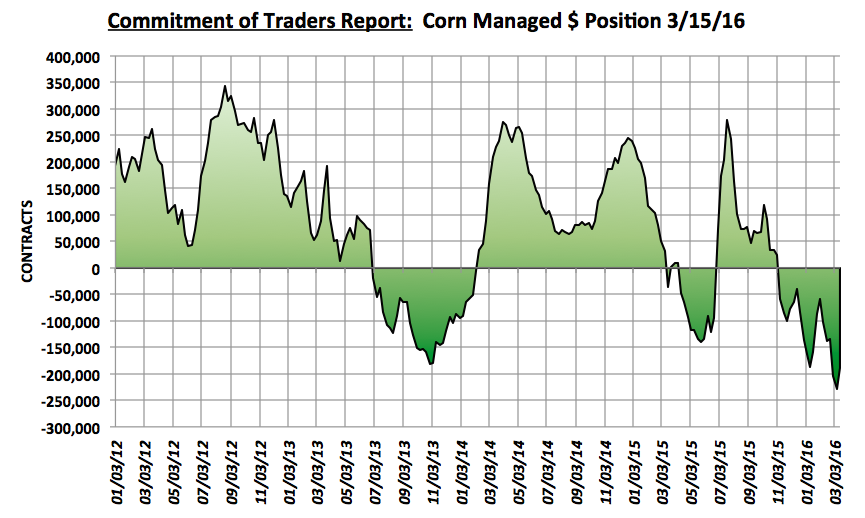
I still continue to see plenty of overhead price resistance primarily in the form of Commercial hedge paper, which is a clear indication of heavy farmer selling. This has proven a more than equal offset to Money Managers looking to square at least a percentage of their record net short position going into the March 31st Prospective Plantings report. This week’s Commitment of Traders report showed the Managed Money net short being reduced by over 41,000 contracts, and yet week-on-week CZ6 closed up just 2 ¼-cents. In fact December corn futures remain just 12 ¼-cents removed from their current contract low of $3.73 ¼.
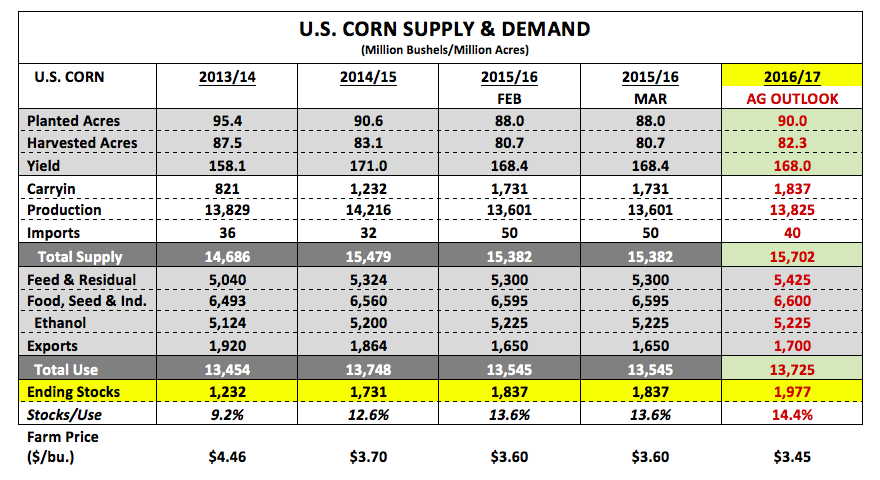
On Friday, Informa did issue a revised 2016 U.S. corn planted acreage forecast of 89.5 million acres, which was 500,000 acres less than the USDA’s February Ag Outlook projection. However unfortunately for Corn Bulls a 500,000 acre decrease isn’t going to be nearly enough to justify a large-scale trend change in corn prices with U.S. corn carryin stocks still estimated at more than 1,800 million bushels.
I continue to trade this market (CZ6) not based on where it is but on where I think the downside risk is in September, assuming there are no legitimate weather problems, the Dollar stays strong, and demand remains stagnate. CZ6 needs to hold both the 35 and 50-day moving averages early next week ($3.842 to $3.847) to avoid another retest of the current contract low.
July Corn Futures Chart
December Corn Futures Chart
Corn Market – Supply/Demand Table
Thanks for reading.
Further reading from Marcus: “Corn Enters Critical Period Of Price Seasonality“
Twitter: @MarcusLudtke
Author hedges corn futures and may have a position at the time of publication. Any opinions expressed herein are solely those of the author, and do not in any way represent the views or opinions of any other person or entity.
Data References:
- USDA United States Department of Ag
- EIA Energy Information Association
- NASS National Agricultural Statistics Service


: Showing Some Signs of Emerging Strength")
