The USDA will release its January WASDE and Crop Production reports on January 12th, 2016. Some final thoughts on the 2015 year in corn futures, as well as, some possible S&D adjustments to watch for in the January reports are below.
US Corn Yield History January versus November Estimates & Likely “Best Case” for Corn Bulls:
Since 2004, the USDA has increased the US corn yield in the January WASDE report on 5 occasions versus 6 decreases. The largest January versus November US corn yield increase totaled 2.3 BPA. Conversely the largest US corn yield decrease totaled 2.4 BPA. However after analyzing the data; what I found somewhat surprising was that yield decreases in the January report were not always synonymous with crop years that experienced below trend-line corn yields or adverse growing conditions. In fact the aforementioned 2.4 BPA January yield decline occurred during the 2014/15 crop year, which produced the best U.S. corn yield on record of 171.0 BPA. Therefore the assumption that a national corn yield decrease isn’t even a consideration for the January Crop report due to how good this year’s growing season was would be inaccurate based on recent historical precedent alone.
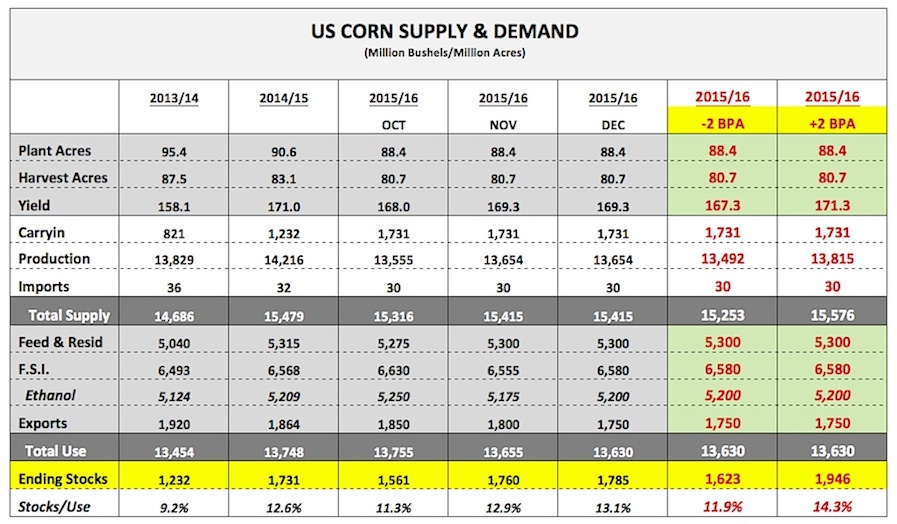
That said…is a 2 BPA US corn yield decline (assuming likely “best case” for Corn Bulls) enough to move the needle on what are surplus 2015/16 US Corn Ending Stocks of 1,785 million bushels?
Let’s for the moment assume the USDA leaves harvested acreage at 80.664 million acres, carryin stocks at 1,731 million bushels, and total US Corn Demand at 13,630 million bushels (all unchanged versus the December 2015 WASDE report). In this scenario, total US corn production would fall to 13,492 million bushels, resulting in a US corn carryout projection of 1,623 million bushels (-162 million versus December). Unfortunately for Corn Bulls even this type of carryout decline would still leave US corn ending stocks more than 440 million bushels ABOVE the 5-year average of 1,180 million bushels (2010/11 – 2014/15). Herein lies the continuing problem for Corn Bulls…even an unexpected (and tangible) US corn yield decrease in the January WASDE report isn’t enough to materially alter the U.S. corn S&D balance sheet.
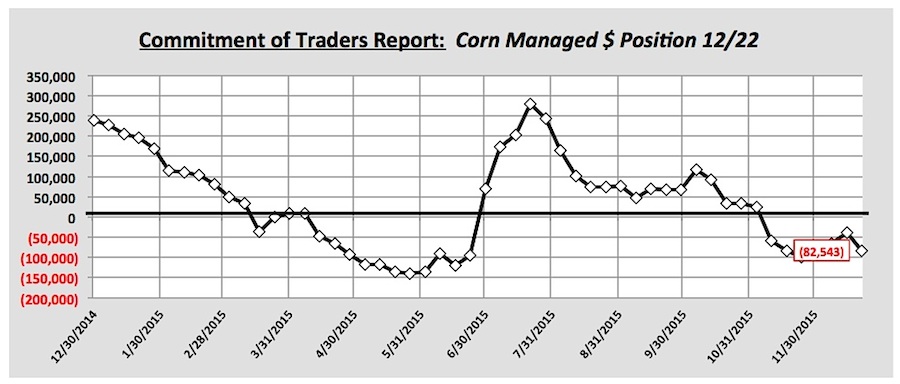
Furthermore, in yet another bearish twist, the latest Commitment of Traders Report showed money managers abruptly reversing course after 2 consecutive weeks of downsizing their short corn position exposures. As of December 22nd the Managed Money short in corn had grown back to -82,543 contracts versus -39,106 contracts the previous week. This appears to be another clear indication the “money” isn’t convinced there’s any momentum shifting fundamental news coming in the immediate future, which I believe is needed to sizably swing the current trend in corn futures.
Can Strong US Corn Ethanol Demand Offset Continued Disappointing U.S. Corn Exports?
US corn-ethanol demand continues to be the one usage sector exceeding expectations. On two separate occasions in 2015 the US Energy Information Administration has shown US ethanol production achieving 1.0 million barrels per day of production or greater in its weekly supply reports (11/20 = 1.008 MMbpd & 12/11 = 1.0 MMbpd), a production level never before attained. For the current 2015/16 marketing year (September through the week ending December 25th) US ethanol production has averaged 967,200 bpd, which annualized equates to approximately 14.8 billion gallons. This would require corn-ethanol consumption of 5,250 million bushels versus the USDA’s current forecast of 5,200 million.
The key question however is, “Can the current ethanol production rate be sustained through the end of the marketing year, which concludes on August 31st, 2016?” In my opinion the answer is no for the following reasons:
- US ethanol stocks are already trending over 20 million barrels; which is they highest they have been in 6 months. Conversely over the last 60 days front-month ethanol futures in Chicago have corrected more than 25-cents per gallon from high-to-low, which has put considerable pressure on spot ethanol margins.
- Gasoline demand historically falls dramatically during the 1st quarter (Jan-Mar). Last year US gasoline demand averaged just 8.805 MMbpd during Q1 2015. In 2014 the Q1 average was even lower at 8.451 MMbpd. Therefore, even with cheap prices at the pump, I’m still expecting a 2 to 2 ½% decrease in gasoline demand during Q1 2016 versus the previous quarter (Q4 2015 averaged 9.203 MMbpd).
Consequently it seems probable that ethanol plants will eventually be forced to throttle back production. If the industry continues to run at its current accelerated run-rate inventory builds appear unavoidable due to depressed Q1 gasoline demand and limited exports. This in turn should continue to pressure ethanol values, as well as, plant margins. Right now my margin model for central Iowa already shows the industry running at approximately breakeven. That said I’m not expecting much of an increase, if any, to the USDA’s most recent corn-ethanol demand estimate in the January 2016 WASDE report.
#NoFilter: PRICE FORECAST
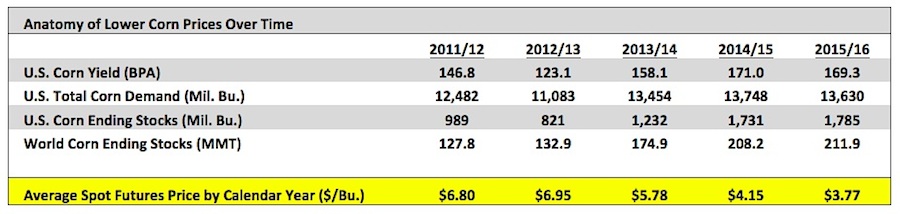
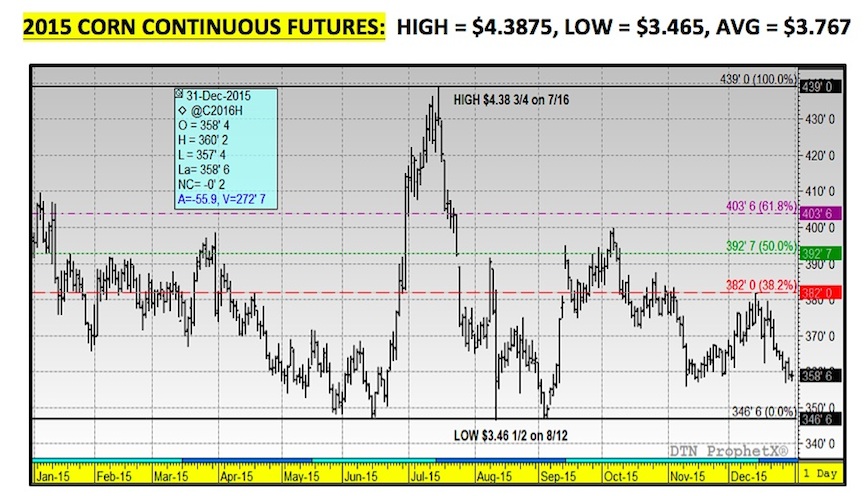
Corn futures appear to be facing an uphill battle as traders shift their focus to 2016. Over the last 3 years the average spot corn futures price has continued to erode due to record U.S. corn yields, no demand growth, and rising U.S./World ending stocks. Note the trend changes below:
2015 then ended with a tsunami of additional bearish news for Corn Bulls including the following:
- Argentina’s presidential election culminated in the elimination of a 20% export tax on Argentine corn (a chief competitor with the U.S.), as well as, a massive devaluation of the Argentine peso.
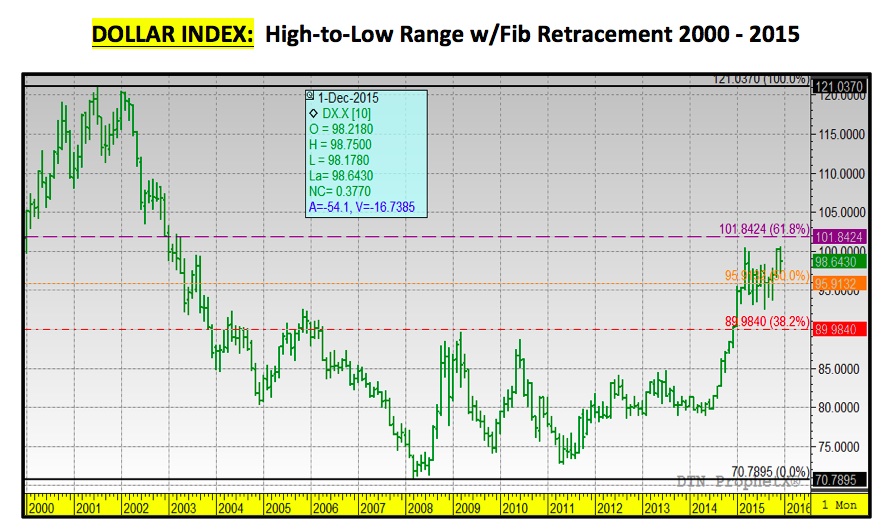
- The Fed increased the new target range for the Federal Funds Rate up to 0.25 to 0.50 percent providing additional support to the US Dollar.
continue reading on the next page…
- On December 28th Reuters reported that China was looking to accelerate sales of its state owned corn reserves with Chinese corn ending stocks ballooning to 114.4 MMT in 2015/16, their highest level since 1999/2000.
- Early estimates from noteworthy private analysts had U.S. corn acreage up 1.5 to 2 million acres in 2016 versus the 88.4 million planted in 2015 DESPITE December 2016 corn futures trading well below $4.00 (CZ6 closed at $3.83 on 12/30).
All of these factors worked to create a counter-seasonal break in corn futures into calendar year end. What will it take to dramatically shift momentum in 2016? From a macro-market perspective, Corn Bulls need to see the Dollar weaken and a recovery in Crude Oil prices.
In corn specifically, until there is a reason to be concerned about a tangible acreage decline due to low prices followed by a weather threat in either the U.S. or South America in 2016, the managed money community will likely remain uninspired by the prospects for a sustainable rally.
Patience will be required…
Best of Luck in 2016!
Twitter: @MarcusLudtke
Any opinions expressed herein are solely those of the author, and do not in any way represent the views or opinions of any other person or entity.
Data References:
- USDA United States Department of Ag
- EIA Energy Information Association
- NASS National Agricultural Statistics Service
: Creating Bullish Divergence?")


 and Semiconductors (SMH): Concerning Price Pattern?")


