March corn futures closed up 5-cents per bushel week-on-week, finishing at $3.61 ½.
Corn bulls will look to extend the near-term rally into overhead price resistance (target zones 3.69 / 3.75). Above that, and 4 dollar corn comes into view… but that is still a ways off.
Let’s review the latest news, data, and analysis for the week ahead.
Weekly Highlights and Takeaways for February 5, 2018
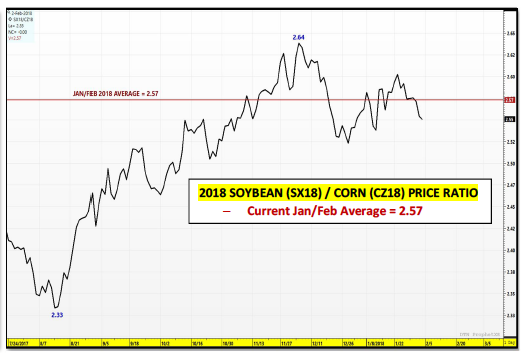
This week I looked more extensively at the impact the new-crop soybean (SX) / corn (CZ) price ratio has had on recent crop year-on-year U.S. corn planted acreage adjustments. In theory, traders have assumed that a price ratio averaging 2.40 or greater during the months of January and February has on paper favored planting more soybeans and fewer corn acres the following spring. That said has recent history proven this out? More specifically…have producers physically responded by shifting their acreage intentions due to this perceived economic indicator and what it implies regarding what crop (soybeans or corn) provides a better return on invested capital?
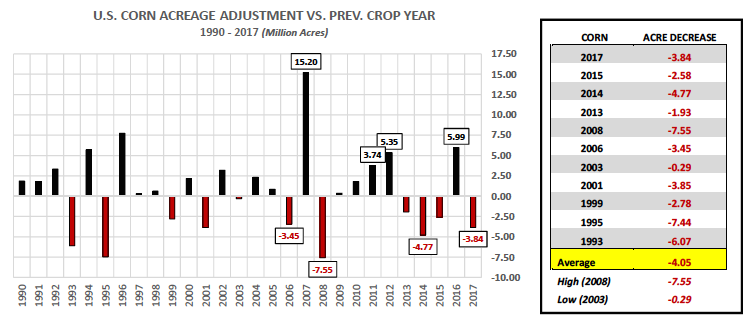
To answer this I went back and looked at all of the crop-year on year U.S. corn planted acreage reductions since 1990. To that end, there have been 11 crop year-on-year U.S. corn planted acreage reductions versus 17 increases (see chart below). Furthermore the 4 largest crop year-on-year U.S. corn planted acreage reductions since 2005 came in 2017 at -3.84 million acres, 2014 -4.77 million acres, 2008 -7.55 million acres, and 2006 -3.45 million corn acres. That said during the January and February timeframe of each of those years the new-crop soybean / corn price ratio averaged the following: 2017 = 2.59, 2014 = 2.46, 2008 = 2.44, and 2006 = 2.43 (see chart on page 2). At present the 2018 new-crop soybean (SX18) / corn (CZ18) price ratio has averaged 2.57 through January 31st. This information would then seem to validate that a ratio of 2.40 or greater has led to a tangible decrease in U.S. corn planted acreage the following spring.
However to insure that the opposite was also indeed true I looked at the 4 largest crop year-on-year U.S. corn planted acreage increases since 2005. They were as follows: 2016 +5.99 million acres, 2012 +5.35 million acres, 2011 +3.74 million acres, and 2007 +15.20 million acres. If the new-crop soybean / corn price ratio was to be considered a reliable indicator it should in theory register an average ratio at or below 2.30 in each of those years (with the economic advantage shifting in favor of planting more corn acres at the expense of soybean acres). That said in 2016 that ratio averaged 2.29 during the months of January and February, 2012 = 2.16, 2011 = 2.28, and 2007 = 1.97 (see chart below). Once again this information would then seem to validate that a ratio of 2.30 or less has led to a tangible increase in U.S. corn planted acreage the following spring.
Where does this leave us for 2018? As I mentioned earlier the current new-crop soybean (SX18) / corn (CZ18) ratio has averaged 2.57 through the month of January. Based on this assessment most traders have assumed total U.S. corn planted acreage will decrease in 2018 by at least some amount. Recently Informa revised its 2018 U.S. corn planted acreage estimate down to 89.2 million acres, approximately 1.0 million acres less than 2017. However I believe the acreage decrease could be even more significant based on the new-crop soybean / corn price ratio. Therefore I’m not ruling out a 2018 U.S. corn planted acreage figure closer to 88.5 million acres.
MARCH 2018 CORN FUTURES PRICE FORECAST:
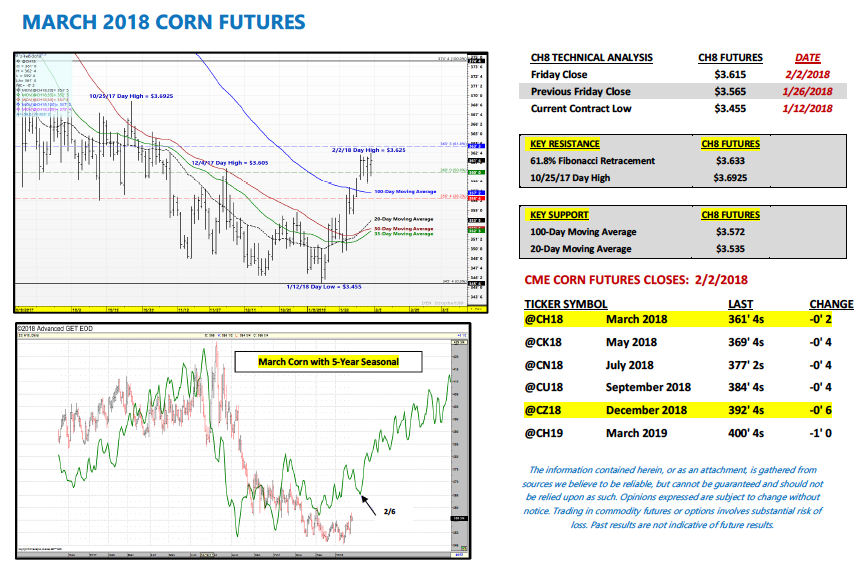
March corn futures traded up to a day high of $3.62 ½ on Friday, its highest level since November 9th, 2017. And although futures prices faded slightly at the close (closed at $3.61 ½) Corn Bulls remain hopeful price momentum has finally shifted higher moving forward. Furthermore, March corn futures have now been able to manage 6 consecutive closes over the 100-day moving average of $3.57 ¼. Holding that key area of price support on small downward corrections will be critical to sustaining this up move into mid-to-last half February. The longer March corn futures can hold the 100-day, the more likely Money Managers will continue covering their massive net short corn position. Friday’s Commitment of Traders report showed the Managed Money short decreasing 88,734 week-on-week.
An additional positive for Corn Bulls this week was excellent weekly U.S. corn export sales. For the week ending 1/25/18 U.S corn export sales for 2017/18 totaled 72.9 million bushels. Crop year-to-date sales remain 20% behind a year ago; however at least for the time being that gap is starting to narrow. This is the first real indication that U.S. corn export sales are benefitting from the break/weakness in the U.S. Dollar Index. The Dollar continued to trade at a 3-year low this week.
Assuming CH18 continues to hold the 100-day moving average, the next topside chart objective would be the day high of $3.69 ¼ on 10/25/17 followed by the 200-day moving average at $3.75 ½.
Twitter: @MarcusLudtke
Author hedges corn futures and may have a position at the time of publication. Any opinions expressed herein are solely those of the author, and do not in any way represent the views or opinions of any other person or entity.
Data References:
- USDA United States Department of Ag
- EIA Energy Information Association
- NASS National Agricultural Statistics Service

: Worrisome to Broader Market?")
