July corn futures closed down 10 cents per bushel week-on-week, finishing at $4.42 on Friday.
Let’s go over a weekly recap of news and data, while discussing this week’s outlook.
Monday’s Weekly Crop Progress report showed U.S. corn planting progress improving to 92% for the week ending June 16. This represented an increase of 9% week-on-week.
However, several traders noted that in at least one state summary, Michigan’s “percent of corn planted advanced not by planters, but the decision of many farmers to opt for prevented plantings.”
Therefore there seems to be yet another layer of fog surrounding the USDA’s updated planting percentages, and whether or not they now all include some interpretation on the amount of prevented plantings in each state.
Next Friday, June 28th, the USDA will release its June Acreage report, which will offer state-by-state planted acreage revisions to the March Prospective Plantings estimate of 92.792 million. I’ve said this for the past several weeks…you can read what you want to regarding how many corn acres we’ll see slashed in that report versus the March forecast.
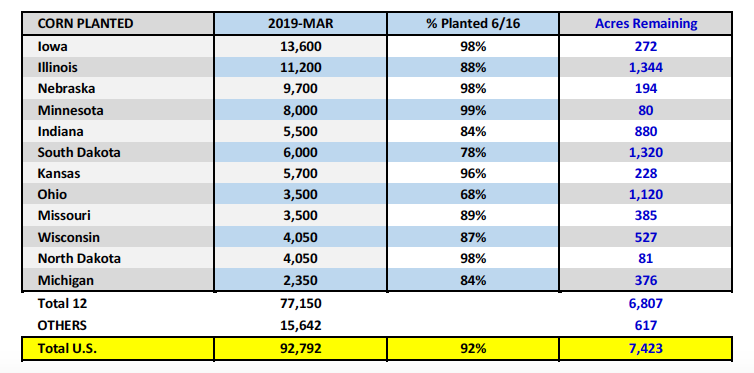
Corn Bulls continue to argue/position for corn acreage being down 9 to 12 million acres. If however we are take the USDA’s latest Weekly Crop Progress report at face value, the planting percentages suggest that as of 6/16 there were approximately 7.4 million corn acres left to plant.
I’m not going to pretend to know whether the number of unplanted acres is 6 to 8 million or 10 to 12 million; however I do believe anything and everything is likely in play regarding the potential for a major market surprise in either direction next Friday.
The one false premise that I see the vast majority of traders making is the misguided assumption that the USDA’s March acreage forecast was 100% accurate. That March planting figure is based on surveys taken during the first two weeks of the month. The SX19/CZ19 price ratio was trading at 2.37 to 2.41 at that time. By the end of May that price ratio was nearly 2.0, the economics strongly in favor of planting corn.
Therefore who’s to say the USDA didn’t underestimate (or overestimate) their March Prospective plantings projection? Just a 1% acreage adjustment equates to 930k acres, 2% equals 1.86 million acres, etc. In my 20 years trading corn, the June Acreage and Stocks reports (both released on 6/28) have often been the most unpredictable reports of the entire calendar year.
What other possible oversights are Corn Bulls making?
Which is so often the case when traders (and producers) have been starved for a summer corn rally of substance for over 5-years, there’s a tendency to overlook the other U.S. (and Global) corn S&D’s in the periphery. I think it’s important to remember that once the supply-side shock is accounted for (primarily acreage losses), it’s going to be U.S. corn carryin stocks and demand that influence the duration and need for higher and higher prices.
That said, this week’s U.S. export sales report showed U.S. corn export sales of just 1.5 million bushels for the week ending June 13th, 2019. Crop year-to-date (2018/19) export sales inched higher to 1.907 billion bushels versus 2.221 billion the previous year, a difference of -314 million bushels or -14.1%. As of the June 2019 WASDE report the USDA was forecasting a -9.7% export sales decline versus 2017/18. Therefore after applying the actual percentage skew, if sustained through the end of the 2018/19 marketing year on August 31st, this suggests the USDA is still overstating 2018/19 U.S. corn exports by at least 100 million bushels. Furthermore the recent decrease in weekly sales clearly says the U.S. is already uncompetitive in world export markets versus Brazil/Argentina at current prices.
Also of note…regarding U.S. corn demand, there were reports of ethanol plants posting bids of 50 and 60-over for Jun/Jul corn in Ohio and Indiana this week. This likely speaks to the lack of planting progress in both states and what I would believe to be a very real fear that both IN and OH will be net deficit corn supplies early in 2020 once feed and ethanol demand are factored in. It appears the current buying strategy is one of desperation (to prevent any stocks from leaving the state, therefore paying any number); however I’m not sure that’s sustainable (or wise).
When you consider that spot ethanol values have rallied low-to-high approximately 37-cents per gallon since May 13th (equivalent to $1.10 per bushel in corn) and July corn futures have rallied $1.21 ¼ per bushel over that same time period, the ethanol/corn crush has moved even more negative since 5/13.
Remember… Industry Average ethanol margins have essentially been negative ongoing since August 2018.
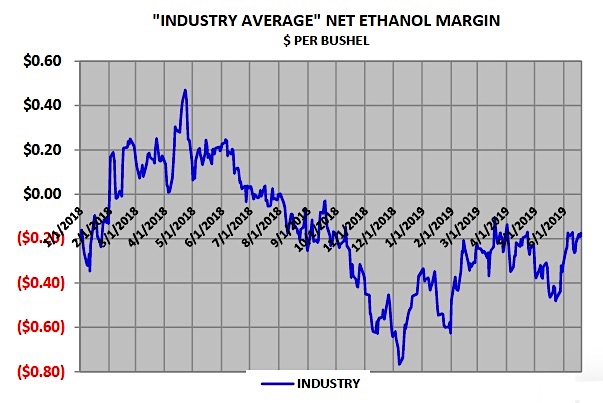
Therefore after accounting for the additional negative margin pressure now being applied via the aforementioned upward explosion in corn basis levels (which has pushed the real price of corn paid for by certain ethanol producers in IN and OH to over $5.00 per bushel), you have to wonder at what point does the cash burn become too much to justify running certain facilities?
Ethanol plants in Indiana, Ohio, and even Michigan will have to make some very difficult post-harvest decisions in late 2019 and early 2020. Southeastern South Dakota could also be another area where the lack of available corn supplies becomes a major issue prior to next summer’s corn harvest. Overall I have to believe the USDA’s current corn-ethanol demand estimate of 5.500 billion bushels for 2019/20 could see some sizable downward adjustments as the new marketing year progresses into Q1 and Q2 2020.
Moving forward into the last week of June and first week of July, I still fully expect corn futures to stay well supported even on minor corrections. The “what-ifs” on U.S. corn (and soybeans) planted acreage, as well as, the U.S. corn yield should provide more than enough storylines for market analysts to keep a healthy premium in corn futures.
That said the question traders really need to start thinking about however is what to do after the “worst” supply-side shocks have been factored into the USDA’s monthly WASDE reports. Even in 2012, the market broke approximately $1.45 per bushel from its August 10threcord high through the end of September. The S&D didn’t really change however the worst-case scenario had now been digested.
JULY 2019 US CORN FUTURES TRADING OUTLOOK – Week of June 24
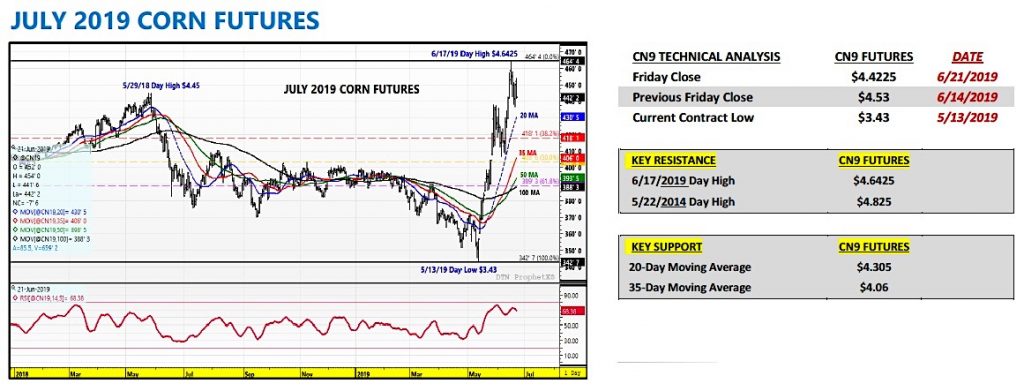
Corn futures limped to the finish line on Friday afternoon, closing down 7 ¾-cents per bushel. This week had a bit of everything with July 2019 corn futures trading up to a new contract high of $4.64 ¼ during Monday’s session with traders once again fearing the worst regarding the USDA’s updated Weekly Crop Progress report (which comes out after the close on Monday’s at 3 p.m. CST). However once the revised planting figures were digested corn futures spent the later part of the week on the defensive.
As I mentioned earlier, this week is all about the build-up to the June 28th Acreage report. If you’re a Corn Bull you have a lot riding on that report validating what is thus far primarily conjecture, regarding just how many corn acres went unplanted. I will say this: If the planted acreage number isn’t less than 85 million acres Corn Bulls will be extremely disappointed.
I’ve been a strong proponent of staying long this market via call options versus owning futures and/or selling puts. The reason being Bull markets usually experience some exhaustive “up” day before eventually rolling over. And that downward correction off of a “spike higher” price acceleration tends to be deeper and faster than anyone’s anticipating.
We saw this in 2012. In 2012 the corn market achieved its record highs during the month of August, which was a result of 2012/13 U.S. corn ending stocks falling to 650 million bushels in the August 2012 WASDE report.
However, on the same day corn futures were setting a record high (8/10/2012), they ended up closing down 18 ¼-cents that afternoon. Corn futures then closed down 17 ½-cents the following session. The two day, high-to-low, trading range equaled 67-cents per bushel ($8.43 ¾ to $7.76 ¾). Point being…if you don’t time your exit strategy perfectly right on the spike higher (selling out of your long position), you’ll be celebrating one minute and calling your banker the next.
Remember tight U.S. corn S&D’s require higher price floors sustained over a period of time…not endless rallies.
Twitter: @MarcusLudtke
Author hedges corn futures and may have a position at the time of publication. Any opinions expressed herein are solely those of the author, and do not in any way represent the views or opinions of any other person or entity.

: Worrisome to Broader Market?")

