Corn Market Drivers for the Week Ending January 29th, 2016
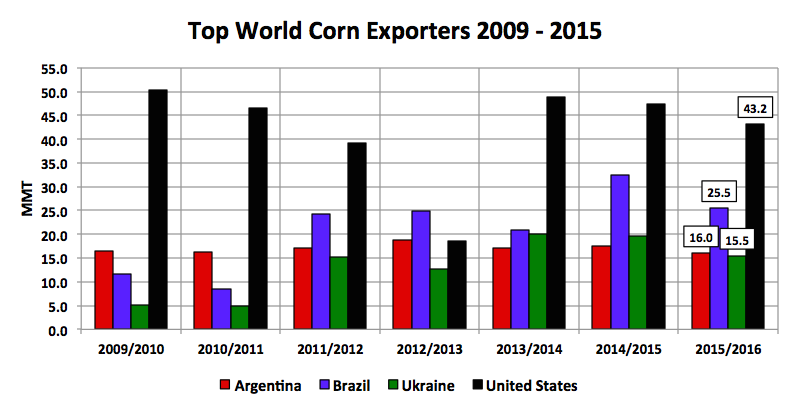
Argentina: Drought conditions continue to persist in northern Buenos Aires, which represents a major corn growing region in Argentina. Some reports are now suggesting irrecoverable corn crop losses. Corn Bulls were clinging to this storyline early in the week hoping it would provide the foundation for the next leg higher in march corn futures (and a base in corn prices). Argentina’s current standing as the 3rd largest corn exporter in the world at face value would seem to suggest this could have major implications on the global corn trade.
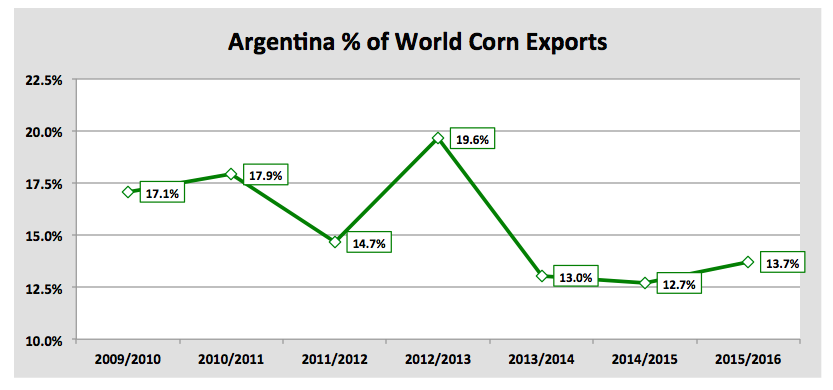
However the reality is Argentina’s perceived importance, based on it being a “Top 3” world corn exporter (trailing only the U.S. and Brazil), is somewhat misleading considering it still only represents approximately 14% of all world corn exports. The United States and Brazil are by far the dominant players in this space accounting for nearly 60% of the total corn exports market.
Furthermore considering 2015/16 U.S. corn ending stocks are more than adequate at just over 1,800 million bushels; the U.S. certainly is in a position to displace any minor void created by production losses in Argentina. How much additional export demand could this generate? A 10% crop loss would lower 2015/16 Argentine corn production to 23 MMT versus the USDA’s January forecast of 25.6 MMT. Argentina is projected to export approximately 63% of its total corn production, which is a threshold that has been relatively constant over the past 5 years. This would push 2015/16 Argentine corn exports down to 14.5 MMT versus the USDA’s January estimate of 16 MMT. Therefore theoretically the United States, Brazil, and/or the Ukraine could step in to displace this 1.5 MMT (or 59 million bushels) of new export market share.
That said with the U.S. corn carryout at its highest level since 2005/06 and record World corn stocks (208.9 MMT), that quantity isn’t nearly enough to significantly alter the direction in corn futures. This is largely the reason why this story has failed to find much traction even with corn prices still trading well below $4.00 per bushel.
Corn-Ethanol Demand: The EIA’s Weekly Petroleum Status report showed U.S. ethanol production dipping to 961,000 barrels per day, the lowest industry assessment since November 27th, 2015. This represented the first clear indication that soaring ethanol inventories (peaked at 21.94 million barrels on 1/15; highest since April 2012) and negative plant margins have started to influence industry run-rates on a broader scale. Corn Bulls had been hoping for an increase to the USDA’s 2015/16 corn-ethanol demand forecast of 5,200 million bushels due to record ethanol production during the month of December. That now appears unlikely with January gasoline demand averaging an extremely disappointing 8.67 MMbpd versus 8.889 MMbpd a year ago despite U.S. gas prices trading at their lowest level since 2009. Needless to say there is a confluence of market forces currently working against any increases to U.S. corn-ethanol demand in the February WASDE report.
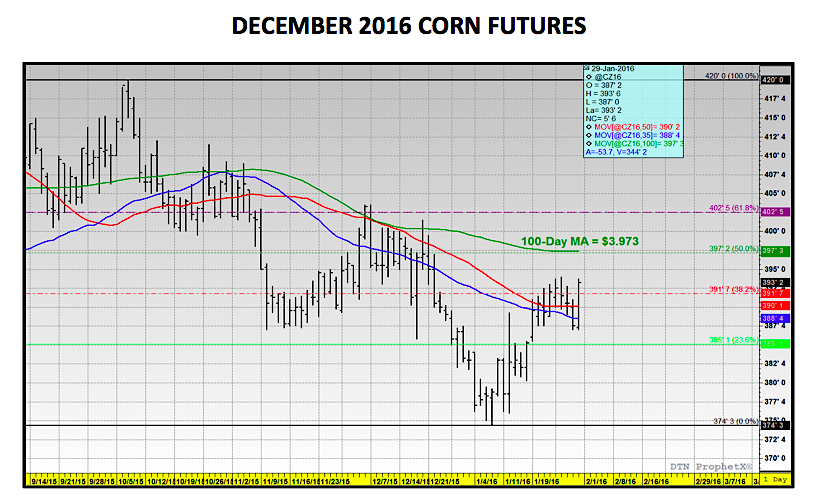
Current March Corn Futures Price Considerations: March corn futures traded up 1 ¾-cents per bushel week-on-week, finishing on Friday at $3.72. Technically corn’s recent uptrend was sustained via the higher weekly close; however it took a 6 ½-cent higher close on Friday to make that a reality. March corn futures appear to have run into some significant headwinds once again over $3.70 per bushel for a variety of reasons:
- Weekly U.S. export sales in corn were just 32.2 million bushels. Current marketing year-to-date corn exports increased to 909.3 million bushels versus 1,232.3 million a year ago (-26%). Therefore traders have yet to see any material improvement in U.S. corn exports even with continuing reports of potential corn production shortfalls in Argentina and South Africa.
- In the USDA’s Grain Stocks report released on January 12th, 2016, December 1st U.S. corn stocks were estimated at 11,212 million bushels. This was even slightly higher than the Dec 1, 2014 forecast, which is even more remarkable considering in 2014 U.S. corn production achieved a new record high of 14,216 million bushels (615 million bushels larger than the 2015 corn harvest). The market implications of this are relatively transparent: Farmers will be looking to take advantage of small rallies to price bushels that are still on-farm or on basis-only contracts with commercials. Invariably this creates another layer of fairly significant selling pressure on even minor upward retracements.
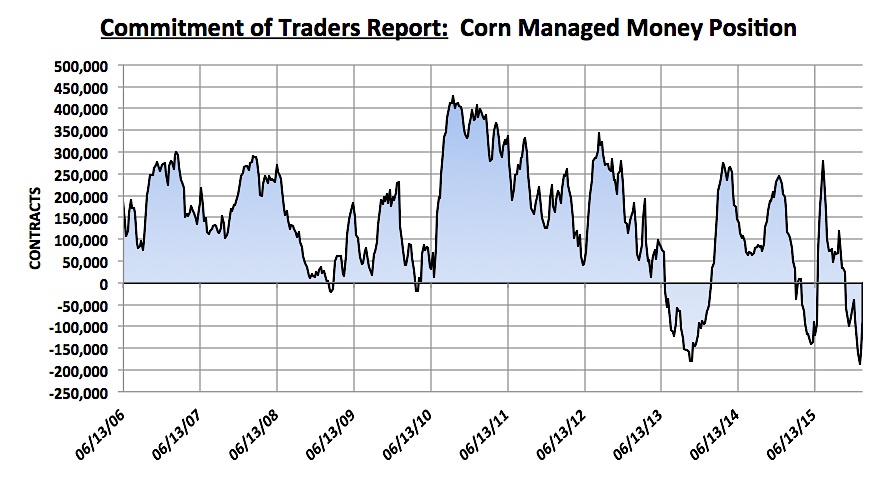
- Friday’s Commitment of Traders report showed the Managed Money net short in corn decreasing to -87,197 contracts. Therefore money managers were buyers of 71,012 contracts week-on-week and yet March corn futures still struggled to manufacture even a slightly higher weekly close. This is another sign of what I referenced in point #2…commercial hedge paper (from farmers selling corn) is now offsetting a large percentage of the Managed Money buying, neutralizing the potential for significantly higher price action.
Technically March corn futures are still in a position to challenge the 100-day moving average at $3.78 ½ followed closely by the 50% Fibonacci retracement at $3.791; however it’s likely going to take another massive push from money managers squaring positions early next week.
Thanks for reading.
Twitter: @MarcusLudtke
Author hedges corn futures and may have a position at the time of publication. Any opinions expressed herein are solely those of the author, and do not in any way represent the views or opinions of any other person or entity.
Data References:
- USDA United States Department of Ag
- EIA Energy Information Association
- NASS National Agricultural Statistics Service


 Breaks Below Key Price Support")
 and Russell 2000 (IWM)")


