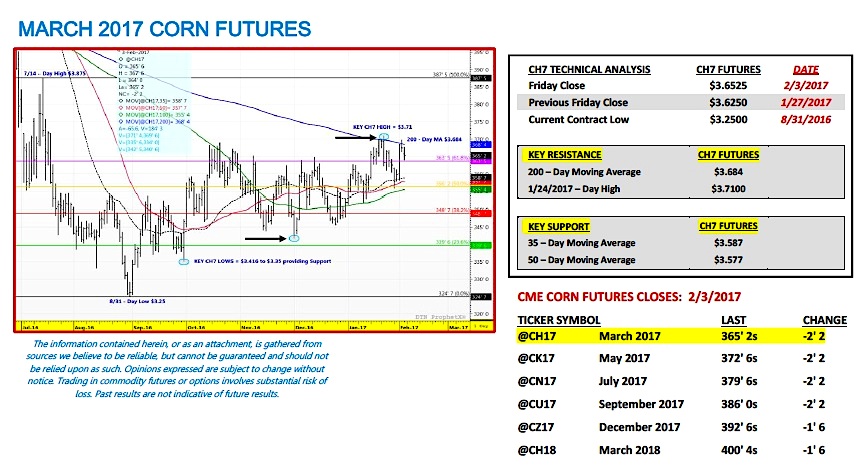
March corn futures moved higher this week, closing up 2 ¾-cents per bushel week-on-week, finishing on Friday (2/3) at $3.65 ¼. CH7 continued to show an inability to close above key price resistance at the 200-day moving average of $3.684, despite challenging that level once again on Thursday. That said the fundamental market focus this week shifted back to U.S. ethanol production…
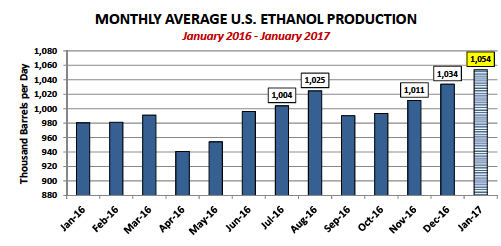
RECORD WEEKLY U.S. ETHANOL PRODUCTION: U.S. ethanol production for the week ending 1/27/2017 averaged a new record high of 1.061 million barrels per day, exceeding the previous high-water mark of 1.054 million bpd established just two weeks ago. Furthermore this was the 14th consecutive week that U.S. ethanol production has exceeded 1.0 million barrels per day. The longest previous such streak totaled just 5-weeks from July 29th, 2016 through August 26th, 2016. U.S. ethanol stocks did increase as well to 21.87 million barrels and are now up nearly 3.2 million barrels since December 30th, 2016.
Is a weekly U.S. ethanol production run-rate above 1.0 million barrels per day sustainable for an entire calendar year? It’s possible yet highly unlikely in my opinion for a number of reasons with the primary reason being fairly straightforward. Ethanol prices have already experienced a significant downward correction as a result of the substantial ethanol inventory increase over the past 30-days. In fact spot CME ethanol futures averaged just $1.494 per gallon in January 2017 versus $1.627 in December 2016. Additionally over that same time period March corn futures traded 8.2-cents per bushel HIGHER on average, $3.618 per bushel in January versus $3.536 per bushel in December. Therefore the industry wide gross corn-ethanol crush margin shrank 16-cents per gallon month-on-month, which resulted in a negative net operating margin scenario for a number of U.S. ethanol producers. Key takeaway…the current pattern of higher ethanol stocks depressing spot ethanol values without the offset of lower corn prices is unsustainable from purely a net margin standpoint for a meaningful percentage of industry producers. The necessary step then over time will be to slow production to correct for the current imbalance (surplus) in ethanol inventories.
Decreased U.S. gasoline demand is one of the major contributors to the rise in U.S. ethanol stocks. U.S. gasoline demand has averaged just 8.222 million barrels per day over the last 4-weeks compared to 8.715 million barrels per day over that same time period in 2016 (down 5.7%). This is having a major influence on the amount of E10 being blending into gasoline (E10 = U.S. gasoline blended with 10% ethanol, which accounts for more than 95% of the fuel consumed in motor vehicles with gasoline engines according to the E.I.A.). A certain percentage of lower domestic E10 blending is being offset with higher U.S. ethanol exports. However I also worry about the prospect of future ethanol exports to countries like China given the tenuous relationship the U.S. is entering into with some of its key trading partners. China recently increased the tariff on U.S. ethanol from 5% to 30%. For the moment I feel confident that the U.S. will continue to find a significant and willing buyer of U.S. ethanol from Brazil at least through Q1 2017; however longer-term the viability of what is currently an accelerated ethanol export pace becomes much harder to predict.
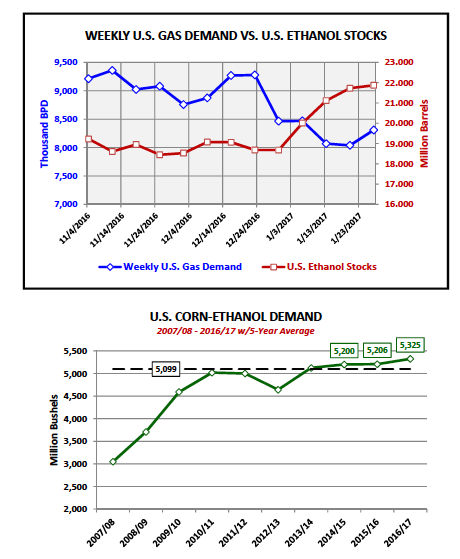
Will the USDA increase 2016/17 U.S. corn-ethanol demand, which was last estimated at 5,325 million bushels in the January 2017 WASDE report? If the USDA’s barometer is the current average of crop year 2016/17 U.S. ethanol production of 1.016 million barrels per day (weekly average from 9/2/16 – 1/27/2017), then the answer is likely yes. The average run-rate for 2016/17 through the week ending 1/27/2017 equates to annualized ethanol production of 15.62 billion gallons, which then corresponds to U.S. corn-ethanol demand of approximately 5,442 million bushels (using an ethanol yield of 1 bushel of corn = 2.87 gallons of ethanol). HOWEVER if the barometer is based on a go-forward view concerning the ethanol industry’s ability to sustain record run-rates DESPITE rising ethanol stocks, depressed gasoline demand, a negative spot margin environment, as well as, several political uncertainties concerning President Trump and his influence on the Renewable Fuel Standard and U.S. trade with China, then answer is likely no. I’m of the opinion that U.S. corn-ethanol demand could go up another 25 million bushels in the February 2017 WASDE report; however I would not expect an increase higher than that at this time.
KEY CH7 PRICING CONSIDERATIONS FOR THE WEEK ENDING 2/3/2017: March corn futures (CH7) closed on Friday (2/3) at $3.65 ¼ finishing up 2 ¾-cents per bushel week-on-week.
KEY TAKEAWAYS FROM THIS WEEK’S PRICE ACTION:
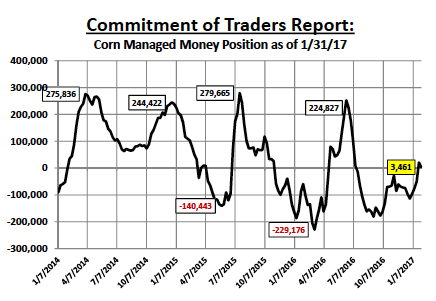
– Technically March 2017 corn futures once again failed to maintain a push above the 200-day moving average ($3.684) on Thursday, which also proved to be the rally stopper the week prior. From a pure price perspective the “buy paper” has thus far evaporated at or near of the upper end of the current trading range from $3.68 to $3.71 CH7. The other disappointing market feature for Corn Bulls this week was Money Managers transitioning to net sellers of corn totaling 17,437 contracts. This reduced the Managed Money net long corn position to just +3,461 contracts. The previous week Money Managers had made an aggressive push to shift from a large net short corn position (-51,385 contracts) to a net long position (+20,898 contracts), however that buying proved unsustainable as March futures prices approached key overhead technical resistance.
– What’s it going to take for March corn futures to close over the 200-day moving average? Clearly something more than strong U.S. corn export sales (45.0 million bushels for the week ending 1/26/2017), as well as, strong U.S. corn-ethanol production. The reality is even if both demand sectors continue to perform the USDA has already largely accounted for the accelerated pace of exports and ethanol run-rates in its January estimates. That said future increases in exports and corn-ethanol demand might collectively add 100 million bushels to total U.S. corn use, which means 2016/17 U.S. corn ending stocks aren’t likely to fall below 2,250 million bushels. Therefore I still believe strongly the fundamental justification for higher corn futures prices (above $3.68 to $3.71 CH7) will have to come from concerns over 2017 U.S. planted corn acreage dropping below 90 million acres and/or fears of Brazil’s safrinha corn crop being reduced. Macro-market price supports will likely necessitate a sell-off in the Dollar Index, as well as, a wave of new Managed Money buying.
Remember…the 5 and 10-year price seasonals in corn turn higher on or near approximately February 8th = PATIENCE REQUIRED for Corn Bulls.
Thanks for reading.
Twitter: @MarcusLudtke
Author hedges corn futures and may have a position at the time of publication. Any opinions expressed herein are solely those of the author, and do not in any way represent the views or opinions of any other person or entity.
Data References:
- USDA United States Department of Ag
- EIA Energy Information Association
- NASS National Agricultural Statistics Service


