Trade volume and volatility on December U.S. Corn futures has been weak, mirroring a similar sentiment and reality on the demand side.
The corn market looks like it needs more time to digest its supply side issues… but there’s a lot going on. Let’s review and discuss the week ahead.
Weekly review and highlights for the week of November 6
- Monday’s Weekly Crop Progress report showed the U.S. corn harvest improving to 54% complete as of October 29th, which compares to 73% a year ago and the 5-year average of 72%. Iowa’s corn harvest increased to 44%, up 21% from the previous week; however still well behind its 5-year average of 70%. Iowa’s current corn harvest percentage would suggest farmers still need to pick approximately 7.56 million corn acres heading into November (2017 Iowa planted corn acreage estimated at 13.5 million acres in the USDA’s June Acreage report). The other notable state still well behind schedule was Minnesota. Minnesota’s corn harvest increased to 38%, up 24% from the previous week; versus its 5-year average of 73%. Minnesota’s current corn harvest percentage would indicate farmers still need harvest approximately 4.96 million corn acres (2017 Minnesota planted corn acreage estimated at 8.0 million acres in the USDA’s June Acreage report). At this time the market doesn’t seem all that concerned about ongoing harvest delays.

- U.S. corn export inspections and sales continue to disappoint. Weekly U.S. corn export inspections totaled just 20.4 million bushels for the week ending October 26th, 2017. This was below the average trade guess of 27.6 million bushels. Crop year-to-date U.S. corn shipments were reported at 199.4 million bushels, down 45.5% versus a year ago. Meanwhile Thursday’s export sales report showed weekly U.S. corn export sales of 31.9 million bushels. Crop year-to-date U.S. corn export sales increased to 670.4 million bushels versus 974.4 million a year ago (-31%). The U.S. continues to lose ground to Brazil in the world corn export market following Brazil’s record large 2016/17 corn crop totaling 98.5 MMT. Included in that total was approximately 66-67 MMT of safrinha corn production, which was harvested in July and August of 2017. Therefore those surplus bushels, along with a weaker Brazilian real (which is trading at its lowest level relative to the dollar since July) are actively displacing current U.S. corn export inspections/sales.
- Both Informa and FCStone issued their November 2017 U.S. corn yield estimates this week, both were larger than the USDA’s October figure of 171.8 BPA. Informa revised its U.S. corn yield forecast to 173.4 BPA for total production of 14.410 billion bushels. FCStone issued similar projections of 173.7 BPA and 14.434 billion bushels. At this time I’m hard pressed to find even a small minority of crop analysts who aren’t expecting the USDA to raise its 2017/18 U.S. corn yield estimate in the November 2017 WASDE report (released on 11/9/17). Furthermore recent history has shown that in 4 out of the past 5 years the USDA has increased the U.S. corn yield in the November report by an average of 2.2 BPA, the largest increase being +5.1 BPA in 2013/14.
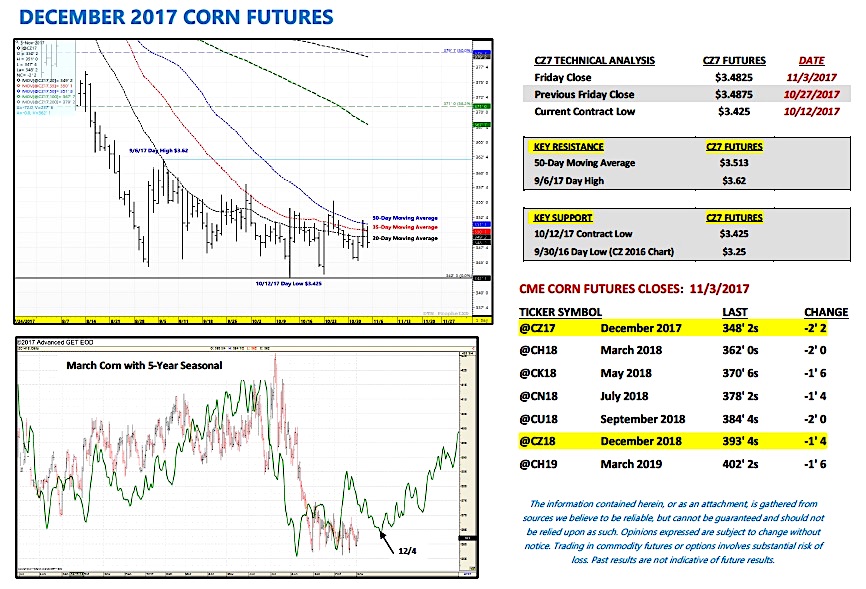
December Corn Futures (CZ7) Short-Term Price Outlook
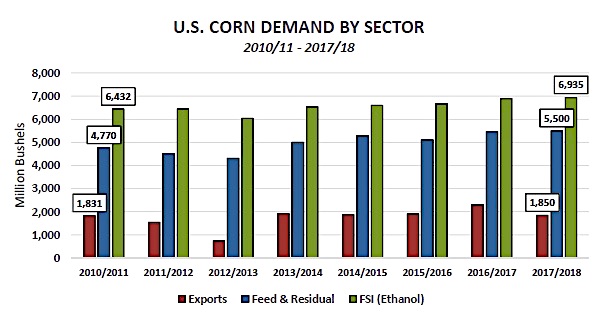
December corn futures got a boost last Thursday from an announced U.S. corn sale of 1.356 MMT (53.4 million bushels) to Mexico for 2017/18 and 2018/19. The problem once again…it was a one-day, “feel good” U.S. corn sale with nothing tangible behind it to suggest that U.S. corn export business might be close to actually turning a corner for the better. Total 2017/18 U.S. corn demand in general remains decent (14.285 billion bushels) relative to the 5-year average (13.960 billion bushels); however “decent” demand isn’t sufficient if the U.S. is going to continue to plant 90 to 91 million corn acres and consistently produce 170 BPA national corn yields. At this rate the U.S. will simply continue to walk forward 2.0 billion bushel ending stocks figures. If you’re a Money Manager there’s not much to get excited about on the long-side with that S&D profile in the foreground.
December corn futures continue to struggle sustaining even small rallies above $3.50 per bushel. Both the 5 and 10-year price seasonals loom large moving forward into the month of November with downward price pressure noted in both through the first week of December. Furthermore last November (2016), December corn futures drifted down to a day low of $3.35 ½ on 11/14 and again on 11/29. The 2017/18 U.S. corn S&D is very similar to a year ago.
All eyes now turn to the November 2017 WASDE report, released next Thursday (11/9) at 11:00 CST.
Twitter: @MarcusLudtke
Author hedges corn futures and may have a position at the time of publication. Any opinions expressed herein are solely those of the author, and do not in any way represent the views or opinions of any other person or entity.
Data References:
- USDA United States Department of Ag
- EIA Energy Information Association
- NASS National Agricultural Statistics Service


