U.S. March corn futures closed down 5 ¼ cents per bushel week on week, finishing at $3.47 ½.
Corn bulls are on the ropes as the fundamental backdrop continues to look weak. But how much is already priced in?
Let’s discuss what’s happening in the corn market and review the week ahead.
Weekly review, news, and highlights for the week ahead – December 18
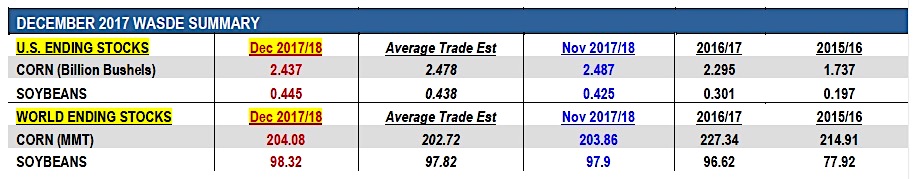
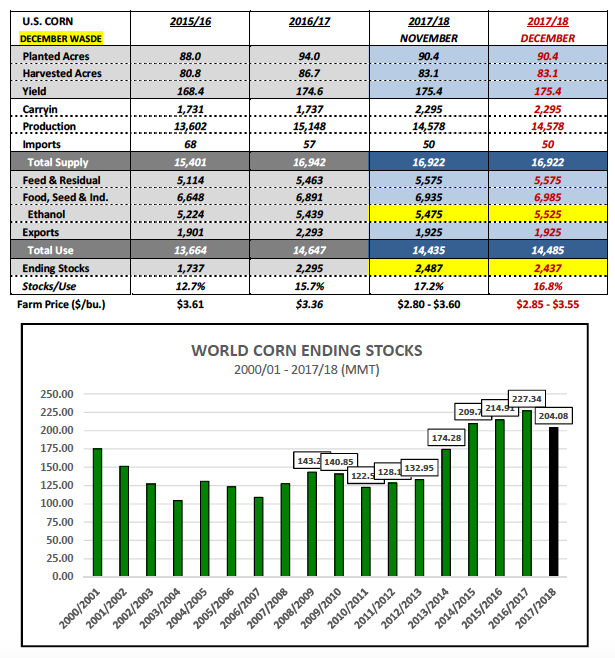
- On Tuesday the USDA released its December 2017 WASDE report, which initially offered some minor price support to the corn market. In that report the USDA raised 2017/18 U.S. corn demand for ethanol by 50 million bushels to 5.525 billion bushels. The net result was a 50 million bushel decrease to 2017/18 U.S. corn ending stocks, which fell to 2.437 billion bushels. This compares to the average trade guess of 2.478 billion bushels and the USDA’s November estimate of 2.487 billion.
- Was the USDA’s increase to corn demand for ethanol supported by the EIA’s weekly U.S. ethanol production estimates? I would argue yes. Since September (the beginning of the 2017/18 crop year) weekly U.S. ethanol production has averaged approximately 1.045 million barrels per day. This average if sustained over an entire 12-month time period would equate to total annual ethanol production of 16.02 billion gallons. The feedstock required to produce that many gallons would approximate 5.670 billion bushels. 125 to 150 million bushels of that total would likely be sourced from sorghum with the remainder coming from corn. Therefore the USDA’s latest corn demand for ethanol estimate of 5.525 billion bushels seems to be well supported; however it should be noted that’s predicated on ethanol industry run-rates continue to operate at a record pace.
- The USDA, somewhat surprisingly in my opinion, left its 2017/18 U.S. corn export forecast unchanged at 1.925 billion bushels despite continued disappointing weekly U.S. corn export sales and shipments figures. I still believe a final U.S. corn export total under 1.9 billion bushels remains a distinct possibility. The latest weekly U.S. corn export inspections figure for the week ending 12/7/17 was 25.92 million bushels versus 34.34 million for the same week a year ago. Crop year-to-date U.S. corn shipments trail 2016/17 by 42%.
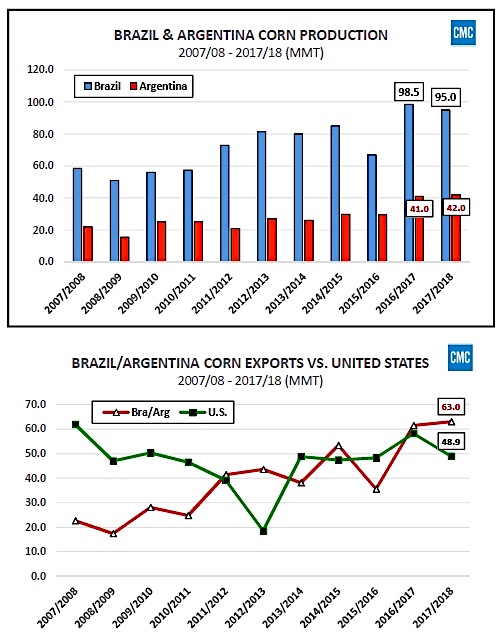
- The USDA did not adjust Brazil or Argentina’s 2017/18 corn production estimates, leaving them unchanged at 95.0 and 42.0 MMT respectively. Therefore even though reports of expanding dryness, specifically in Argentina, have continued to circulate the USDA did not feel inclined to lower its production assessment in the December report. Projected 2017/18 corn exports from Brazil and Argentina combined remained at 63 MMT, representing 42% of total world corn exports (comparatively U.S. corn exports were estimated at 48.9 MMT, 32% of total world corn exports).
- 2017/18 WORLD corn ending stocks improved slightly to 204.08 MMT versus 203.86 MMT in November and the average trade guess of 202.72 MMT. World corn stocks remain substantially below the record high established in 2016/17 of 227.34 MMT; however compared to the 10-year average of 169.8 MMT, the carryout remains more the adequate. Additionally China, the world’s 2nd largest corn producer, saw its 2017/18 corn production estimate raised slightly in December to 215.89 MMT.
- As far as the U.S. soybean S&D was concerned, the USDA increased 2017/18 U.S. soybean ending stocks 20 million bushels to 445 million. The trade was largely expecting this increase, which I believe was one of the key reasons January soybean futures broke 45-cents from a day high of $10.15 on 12/5 to a day low of $9.75 on 12/12 (the day the December 2017 WASDE report was released). The USDA lowered its export forecast to 2.225 billion bushels versus 2.250 billion in November following several weeks of lower than expected U.S. soybean export sales and inspections figures. I’m of the opinion that future export decreases could be in the offing in either the January or February WASDE reports if weekly export sales don’t improve significantly over the next 4 to 6-weeks.
CH8 March Corn Futures Short-Term Price Outlook
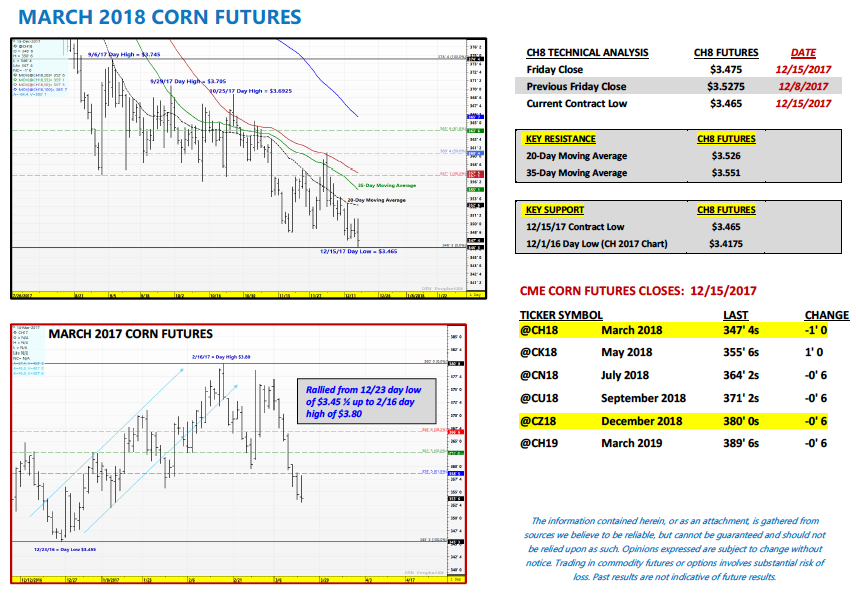
March corn futures closed down 5 ¼-cents per bushel week-on-week, finishing at $3.47 ½ on Friday afternoon. Also of note, March corn made a new contract low on Friday of $3.46 ½. Corn futures continue to face overwhelming fundamental price pressure. Even though the USDA lowered 2017/18 U.S. corn ending stocks in the December 2017 WASDE report 50 million bushels, the revised carryout figure of 2.437 billion bushels still represented a 30-year high. I also believe traders are wary of a potential U.S. corn ending stocks increase coming in the January 2018 WASDE report by virtue of either a cut to U.S. corn exports and/or an increase to the 2017/18 U.S. corn yield (the USDA will finalize the 2017/18 U.S. corn yield in the January report). Therefore U.S. corn ending stocks above 2.5 billion remains a possibility.
Corn also experienced additional price pressure from the soy complex. January soybean futures closed down 22 ½-cents per bushel week-on-week closing well below both its 100 and 200-day moving averages at $9.67 ¼ on Friday afternoon.
Is there still hope for a corn rally? Last year, under a similar S&D backdrop, March corn futures managed to rally from a day low of $3.45 ½ on 12/23/16 to a day high of $3.80 on 2/16/17 (chart on page 4). That said Corn Bulls will have to hope Money Managers grow leery of being short CH8 at such discounted price levels and look to buy back a good percentage of their short positions with calendar year end quickly approaching. (Managed Money short = -197,192 contracts as of 12/12).
Twitter: @MarcusLudtke
Author hedges corn futures and may have a position at the time of publication. Any opinions expressed herein are solely those of the author, and do not in any way represent the views or opinions of any other person or entity.
Data References:
- USDA United States Department of Ag
- EIA Energy Information Association
- NASS National Agricultural Statistics Service

: Showing Some Signs of Emerging Strength")

