December corn futures closed down 4 ½-cents per bushel, finishing the week at $3.71 ¼.
Here’s a look at recent corn data and news highlights, along with my analysis and outlook for Corn futures prices.
Tuesday’s Weekly Crop Progress report showed the U.S. corn harvest reaching 66% complete as of November 10, 2019, which compares to 83% a year ago and the 5-year average of 85%.
Iowa, Illinois, Nebraska, and Minnesota all saw their corn harvested percentages eclipse a minimum of 60%; however of that group only Nebraska was within 10% of its 5-year average (74% harvested versus 83% on average). The rest still trailed their 5-year averages by approximately 20%.
However the most significant and alarming harvest delays continued in the upper Midwest/WCB with North Dakota just 15% harvested versus 76% on average and South Dakota 39% harvested versus 82% on average. Several locations were attributing the lack of harvest progress due to wet/high moisture corn and even propane shortages.
Regardless it now appears likely producers in the Dakota’s, Wisconsin, and Michigan could be picking corn into and through the Thanksgiving holiday weekend.
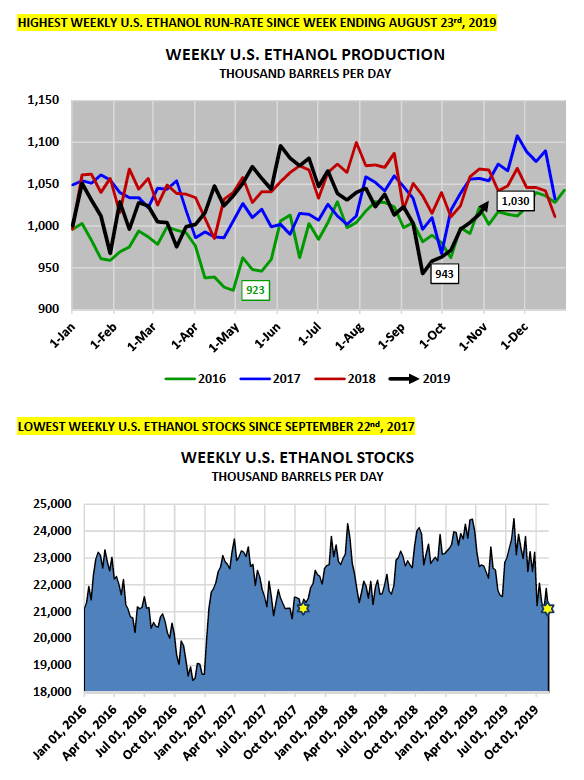
Thursday’s Weekly EIA report showed U.S ethanol production increasing to 1.030 million barrels per day, the highest weekly run-rate since the week ending August 23rd, 2019 (1.038 MMbpd).
Weekly U.S. ethanol production has now increased 7 consecutive weeks after dropping to just 943,000 barrels per day for the week ending September 20th, 2019, which at that time was the slowest run-rate the industry had experienced since April 2016.
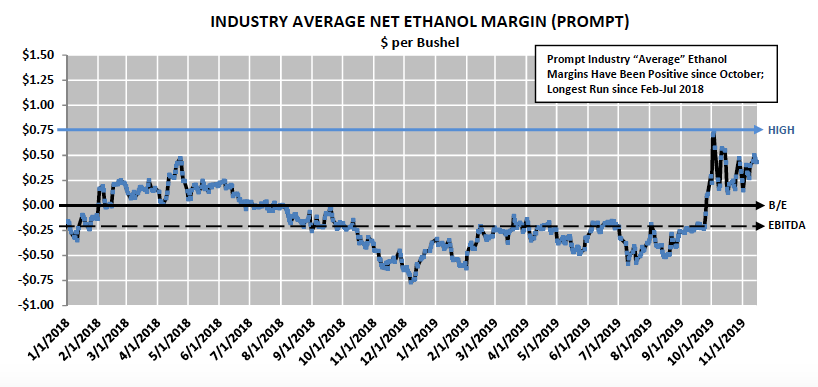
It was also a true representation of the state of the industry following what had been approximately a 14-month run of negative industry “average” net ethanol margins, with 10 of those 14-months also drifting below cash positive EBITDA.
U.S. ethanol producers were finally forced to acquiesce to various external market forces (most of them driven by policy, such as Chinese/Brazilian tariffs on U.S. ethanol and EPA’s granting of SRE’s), which resulted in a combination of plant closures, plant shutdowns, and/or plants still operating but running at less than full capacity. The predictable declines in both weekly U.S. ethanol production and U.S. ethanol stocks eventually produced the intended effect of a sharp rally in industry average ethanol margins back to positive territory for the first time since August 2018. The question now is: Can it continue?
There are a number of factors that need to be assessed regarding the ethanol industry’s ability to sustain this latest resurgence to positive ethanol margins into the month of December and beyond.
With weekly U.S. ethanol production now ramping back up to levels at least approaching the 2018 U.S. calendar year average of 1.046 MMbpd; how long will it be before U.S. ethanol stocks start to again climb higher?
Considering this week’s EIA report showed U.S. ethanol stocks falling to just 20.985 million barrels, their lowest level since September 22nd, 2017, I think it’s reasonable to assume that there will still be some tangible time lag between consistent weekly production figures over 1.025 MMbpd equating to ethanol stock builds back to 23 million barrels (a stocks level that would likely pressure front-end ethanol values). This then increases the probability of prompt industry average ethanol margins remaining positive into early December.
HOWEVER, longer-term (beyond December 2019) the market constraints that triggered the beginning of the U.S. ethanol Supply and Demand imbalance in the first place, which pre-empted the 14-months of negative margins, really haven’t changed.
As long as Chinese and Brazilian tariffs remain in place on U.S. ethanol imports (two indispensable export destinations) and the EPA stands by its recent proposal to account for small-refinery exemptions based on projected gallons lost versus actual gallons lost, burdensome U.S. ethanol stock increases appear unavoidable in the not too distant future. There’s also the seasonal decrease in winter gasoline usage, which only serves as yet another blow to an industry desperately seeking greater demand penetration.
The other hurdles to sustaining a positive industry ethanol margin beyond early December are already in play and recognizable by assessing deferred values for both ethanol and corn.
The ethanol market continues to trade in a steep inverse approaching 6 to 8-cents per gallon from November to December (Chicago). Meanwhile cash corn basis levels are trading at a substantial premium for December delivery relative to spot basis values, which is an indication of the post-harvest market for corn (end-users will have to “incentivize” producers/commercials to pull corn out of storage during LH November and December). The combination of lower priced ethanol values and higher corn costs is already translating to breakeven industry average net ethanol margins for December and January.
As someone who actively works with both corn producers and ethanol plants on a daily basis, I (like the rest of the rural Midwest) am cheering for a more stable/positive margin footprint for the ethanol industry moving forward. Unfortunately I’m still not convinced the real impediments prohibiting future, sustainable ethanol demand growth (tariffs and SRE’s) are any closer to being eliminated. That said, I would obviously lean toward hedging a percentage of the forward margin curve if and when the opportunity presents itself in early December.
US Corn Futures Trading Outlook – Week of November 18
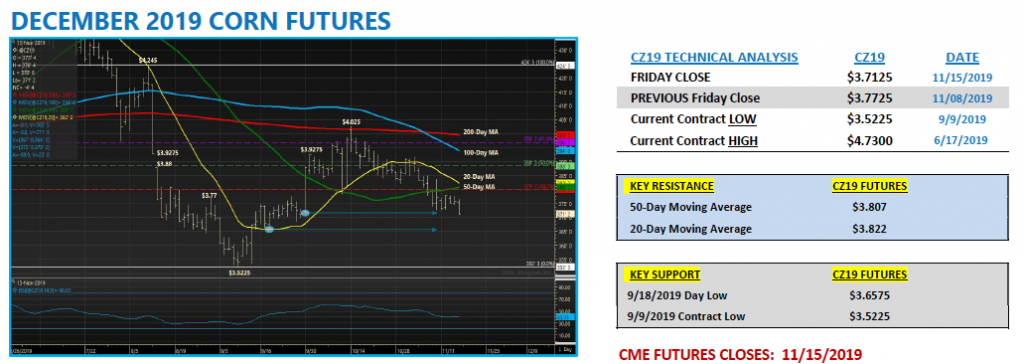
Corn futures sold off to their lowest level this afternoon since September 27, 2019, closing just a ½-cent per bushel off the day low of $3.70 ¾. A variety of factors continue to work against Corn Bulls at the moment (even at current, depressed values) including the following:
- Friday’s Commitment of Traders report showed Money Managers continuing to extend their net short corn positions into mid-November. As of the market closes on 11/12/2019 the Managed Money net short in corn was estimated at -110,921 contracts. Comparatively…4-weeks earlier that net short was just -66,141 contracts. Since 2015 there’s only been one other time Money Managers have increased their net short corn position exposures beyond -100,000 during the month of November (2017).
- That said, “Why is the “Money” continuing to sell corn?” Even inclusive of today’s corn close, December corn futures are still trading higher than they were at this time in 2018, 2017, 2016, and 2015. Furthermore in all 4 of those years December corn futures eventually traded below $3.60 CZ during the month of November. Therefore, from a seasonality standpoint and a comparative pricing standpoint, history would suggest CZ19 still has 10 to 15-cents of potential downside in play into the end of the month.
- And finally, this week’s export sales data for corn was again seen as Bearish (even taking into account the USDA’s recently revised U.S. 2019/20 corn export forecast of 1.850 billion bushels in the November 2019 WASDE report). Weekly export sales in corn were just 22.9 million bushels for week ending 11/7/2019. Crop year-to-date sales remained 47% behind 2018/19. It’s going to be extremely difficult to narrow this sales gap after January 1 if Brazil’s first corn crop still looks good and if the perception is Brazil’s safrinha corn crop will be planted on time.
Twitter: @MarcusLudtke
Author hedges corn futures and may have a position at the time of publication. Any opinions expressed herein are solely those of the author, and do not in any way represent the views or opinions of any other person or entity.


