 Early Tuesday morning the corn and soybean markets finally showed some signs of life, reacting in large part to Monday’s Weekly Crop Progress report, which was mildly supportive to the soy complex in particular. US soybean planting progress increased 10% week-on-week improving to 71% versus 70% on average and 75% a year ago. And while on the surface there was nothing materially bullish about the USDA’s revised national soybean planting percentage, I believe the immediate upward price response was due to the market psychology of planting progress now falling behind 2014 for the first time since April 26th.
I’ve mentioned in previous weekly summaries that several private analysts had been anticipating another 1 to 2 million planted soybean acres over and above the USDA’s March Prospective Plantings forecast of 84.6 million. That said after incorporating NOAA’s most recent 5 to 7-day total precipitation models (which show continued chances for rain over large sections of the Midwest), along with the aforementioned 2015 planting pace technically drifting below 2014, I’m going to assume that certain trade circles have now started to question the viability of those additional acres being planted. Furthermore, the Commitment of Traders report as of 5/26/2015 highlighted a “managed money” net short in soybeans in excess of 100,000 contracts versus a net short of just 32,000 contracts the month prior, thus establishing market conditions that were nearly ideal for a short-covering rally in soybean futures. Therefore I don’t think anyone was that surprised that November soybeans managed a 28 ¼-cent pop in price from the day low on Monday ($8.96 ¾) through the day high on Thursday ($9.25). We should maintain some perspective however in that prior to this move higher, November soybeans had broken nearly 71-cents from the day high on April 30th of $9.76 ½ to the day low on June 1st of $8.96 ¾.
That said the question that will plague the soybean market all summer long is, “Should upward corrections in soybean futures be viewed as selling opportunities or is the price action signaling the potential for something greater due to an acknowledged and legitimized S&D concern?” I would argue that the current move reflects more of a market that was oversold and ripe for an upward correction even if the context used to initiate the rally was based originally on a “lower-than expected” planting progress figure. I’d remind those suggesting otherwise that the 2015/16 US soybean carryout is still forecast at 500 million bushels (largest since 2006/07), and that’s without even one of those additional (and now in question) soybean acres being reflected in the USDA’s May stocks estimate. From a technical vantage point, until November soybeans pose a serious challenge to the 35-day moving average at $9.355 and/or the 50-day moving average at $9.414, two key areas of resistance, soybeans in my opinion are still a commodity that is likely to work lower over time until there is a tangible yield concern. Even down markets experience range bound rallies, which are often the result of money managers banking profits on previously held short positions. It does not mean that those same money managers will now look to get long the soybean market. More technical work will need to be done by Soybean Bulls before that argument can be substantiated. Friday’s price action and 9 ¾-cent lower close in November soybeans would seem to support that conclusion.
As far as corn is concerned, the corn market’s bounce on Tuesday seemed to have more to do with the strength in soybeans and corn trying to follow versus a fundamental shift in market bias. Corn planting progress improved to 95% complete as of May 31st versus 94% on average and 94% a year ago. The top 5 corn producing states of Iowa, Illinois, Nebraska, Minnesota, and Indiana were all 94% planted or better with Illinois reported at 100% complete. The good-to-excellent rating for the US corn crop held steady at 74% versus 76% a year ago and 63% in 2013. There remain however a couple key corn states off to less than ideal starts due to excessive moisture, including Kansas and Missouri. Kansas’s corn crop was only 86% planted versus 97% on average as of May 31st with 50% of its crop rated good-to-excellent. Meanwhile Missouri’s corn crop was 87% planted versus 95% on average with 53% of its crop rated good-to-excellent. Collectively are Kansas and Missouri big enough corn producing states to justify a sustainable trend change in the direction of corn prices? From a national perspective the answer is no.
Technically December corn did manage to break through the 35-day moving average ($3.814) early in Friday’s session; however that momentum quickly stalled with corn prices once again fading the 2nd half of the session. December corn’s inability to trigger adequate buy-stops above the 35-day moving average (despite a sizable managed money net short in corn not dissimilar to soybeans), combined with a lower close on Friday, both serve as key indicators that end users still likely view this bounce in corn futures as being short-lived.
Next Wednesday June 10th, the USDA will issue the June WASDE report. I would expect we’ll see a continuation of the surplus US and World carryout estimates for corn and soybeans that were noted in the May report one month ago.
December Corn Price Chart
November Soybeans Price Chart
Checking In On Ethanol
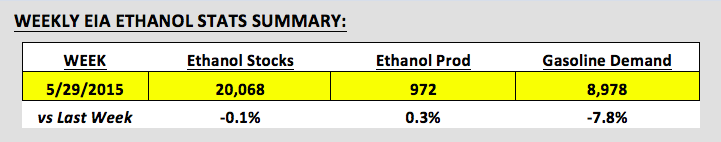
Wednesday’s EIA report showed US ethanol production improving to 972,000 bpd, which represented the 4th consecutive weekly increase and fastest industry run-rate since the week ending January 23rd, 2015 (978,000 bpd). Gasoline demand however was off 7.8% week-on-week falling to 8.978 MMbpd versus 9.104 MMbpd for the same week in 2014. That said despite the elevated ethanol run-rate and material decease in gasoline demand, ethanol inventories still fell slightly coming in at 20.068 million barrels. US ethanol stocks are currently the lowest they have been since January 2nd, 2015, however relative to the same week in 2014; inventories are still up more than 1.8 million barrels. Therefore some perspective needs to be applied when analyzing the potential price significance of this week’s ethanol stocks draw. The US is still sitting on significant ethanol inventories. As a point of reference ethanol stocks never even exceeded 19.0 million barrels during calendar year 2014.
On Friday, May 29th, the EPA released its proposed Renewable Fuel Standard blending requirements for 2014, 2015, and 2016. The trade focus was primarily on the EPA’s proposal for conventional renewable fuel (corn-based ethanol) for 2016, which came in at 14.0 billion gallons. Corn-ethanol supporters were largely disappointed with the EPA’s figure considering it essentially eliminated the need to grow the conventional renewable fuel market beyond its current size. US ethanol producers are already capable of producing more than 15.0 billion gallons of corn-based ethanol annually.
Thanks for reading and have a great weekend.
Data References:
- USDA United States Department of Ag
- EIA Energy Information Association
- NASS National Agricultural Statistics Service
Any opinions expressed herein are solely those of the author, and do not in any way represent the views or opinions of any other person or entity.

: Worrisome to Broader Market?")

