Stock Market Takeaways:
The S&P 500 Index INDEXSP: INX may be overstating the health of the stock market.
Most stocks have struggled since January 2018 and even S&P 500 Volatility INDEXCBOE: VIX has picked up.
Despite shift in risk/reward backdrop, aggregate exposure to equities is elevated and cash remains unloved.
A more conservative allocation to equities could smooth overall portfolio volatility.
Market Analysis
Historically, lopsided trading on a daily basis can obscure the larger reality that since January 2018 stocks have generally struggled to sustain any upside progress.
Consider the following: From the cycle lows in February 2016 through the January 2018 high, the S&P 500 was up nearly 50%, with the median stock in the index up slightly more than that. Small-caps and mid-caps full participated in that rally, with the median stock in the S&P 1500 (which is a composite of 500 large-caps, 400 mid-caps and 600 small-caps) also seeing a gain in excess of 50%. Since January 2018 (through mid-August 2019), the S&P 500 is up 5%, the median S&P 500 stock was basically flat, and median S&P 1500 stock was down nearly 10%.
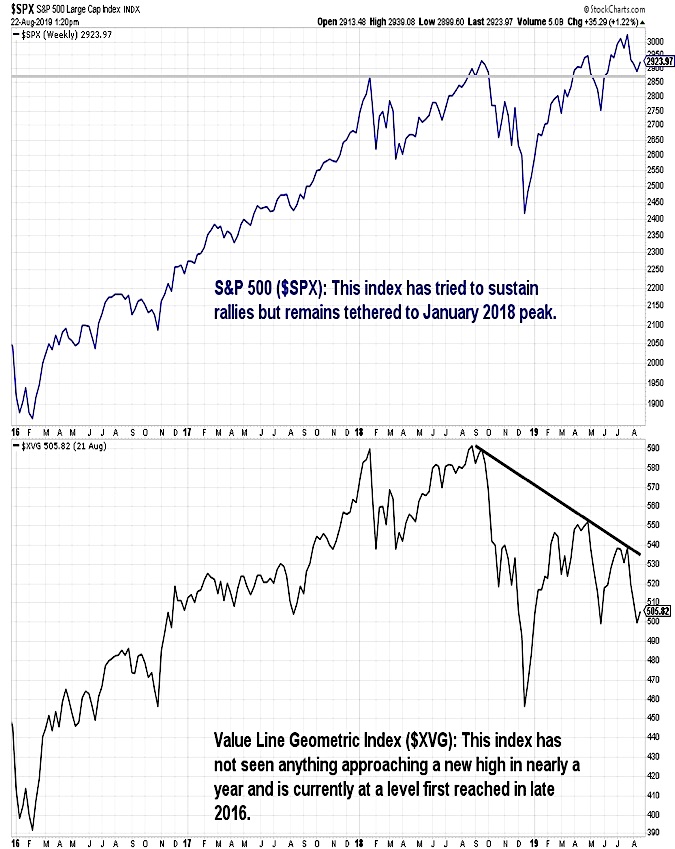
This changing dynamic can be seen in the recent behavior of the S&P 500 and Value Line Geometric Composite index. Both enjoyed sustained rallies in 2016-2017. Since then, the S&P 500 has made multiple forays into record territory only to return often to the level first surpassed in January 2018. The Value Line Geometric Index, which represents the median stock, has made a series of lower highs and is currently 14% below its January 2018 peak.
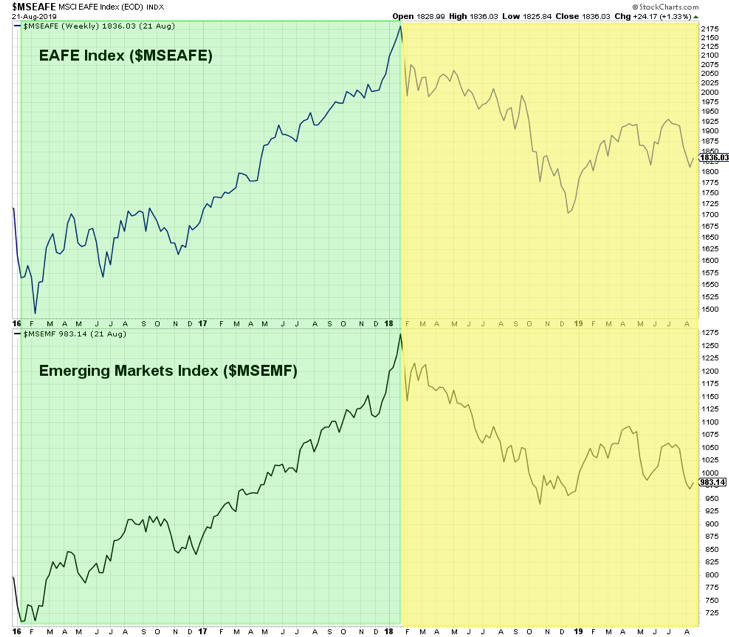
The shift in stock market behavior since January 2018 is even more stark when looking overseas. International stocks enjoyed the tailwind experienced by US stocks in 2016 and 2017. Developed markets (EAFE) rallied 45% from the 2016 low to the January 2018 high, while emerging markets were up over 80% in that time period. Since then, the EAFE index is down 16% and the emerging market index is down 23%.
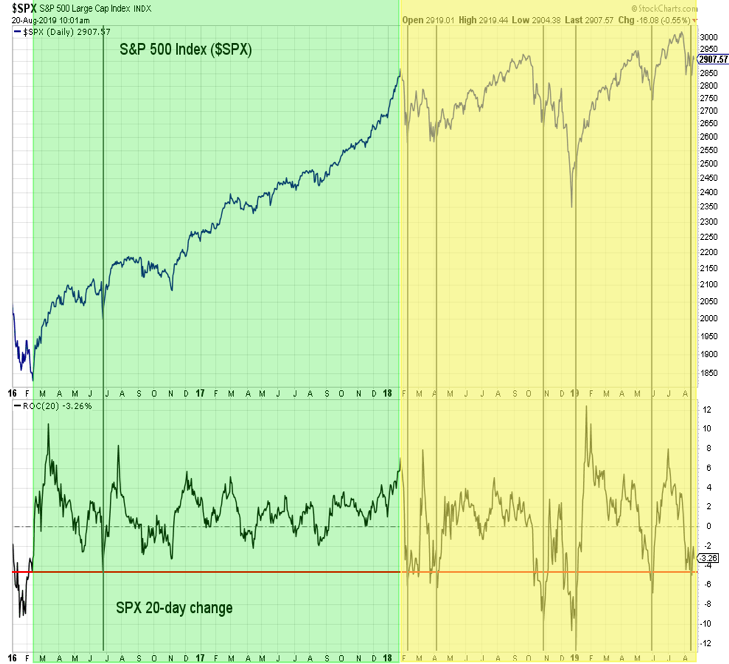
The lack of sustained upside progress for US stocks since January 2018 has been accompanied by an increase in overall volatility. The maximum 20-day decline for the S&P 500 from February 2016 to January 2018 was just shy of 5%. Since January 2018, the S&P 500 index has endured more significant declines on six discrete occasions, the most significant of which was last December’s 20-day decline of more than 10%.
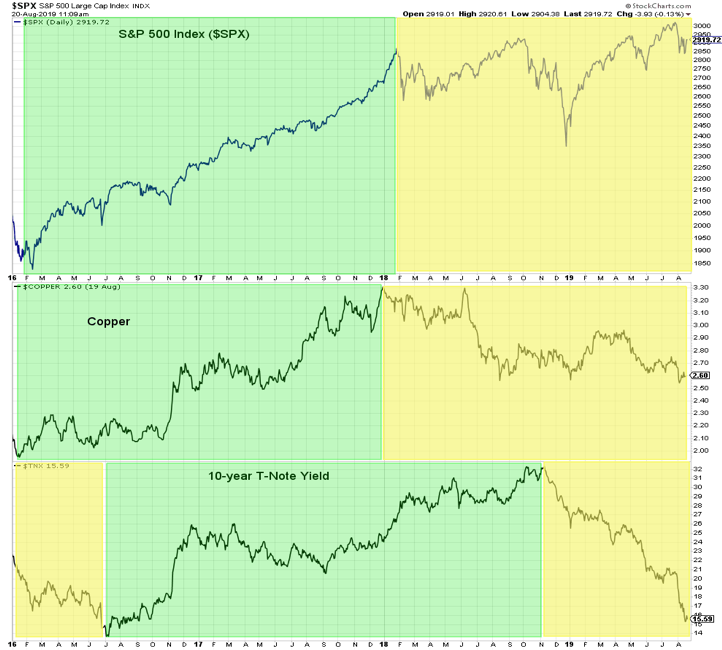
The shift in the risk/reward profile for stocks since January 2018 has been echoed elsewhere. Copper prices peaked in December 2017 after a 68% rally and have fallen 21% since then. So far, at least copper has held support at its mid-2018 low. Bond yields have lagged the moves seen in stocks and commodities. The yield on the 10-year T-Note did not reach its cyclical low until July 2016 and peaked in October 2018. To some degree, the decline in bond yields since then is a reflection of the ongoing message from stocks and copper and may not necessarily be indicating a new round of weakness.
Evidence that the dynamics in place since January 2018 are fading would include renewed equity market strength beyond just the S&P 500 and would likely be confirmed by improving trends in copper and a turn higher in bond yields.
Periods of consolidation following periods of strength are a natural part of the stock market cycle. A proper understanding of individual risk tolerances and an awareness of current risk/reward dynamics can help investors weather volatility and tilt away from the crowd at extremes.
We come back to this chart quite often because it seems to tell an important story. After a decade worth of stock market gains in the wake of the financial crisis, total household exposure to equities is near all-time highs. If there is an unloved asset class, it is cash (which is near historical lows). Weekly sentiment data from the AAII suggests investors are nervous, but this may be due to the un-compensated volatility of the past 18+ months.
Twitter: @WillieDelwiche
Any opinions expressed herein are solely those of the author, and do not in any way represent the views or opinions of any other person or entity.


