After Friday’s Nasdaq beatdown, it may be useful to look at some DeMark charts to keep things in perspective.
Today I’ll look at daily and weekly charts for the PowerShares Nasdaq 100 ETF (NASDAQ:QQQ), the SPDR S&P 500 ETF (NYSEARCA:SPY), and the iShares Russell 2000 (NYSEARCA:IWM) – all through last Friday, June 9.
An Update on the Major Stock Market Indices (ETFs) Based on DeMark Indicators
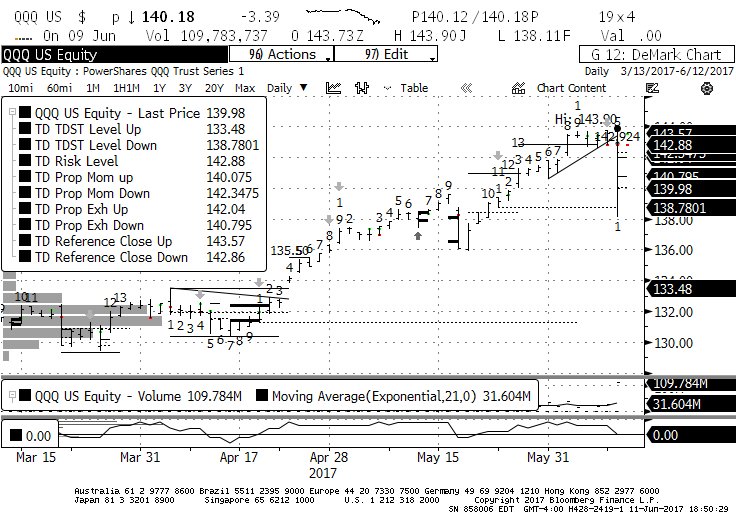
Nasdaq 100 ETF (QQQ)
The QQQ daily chart shows that the latest Countdown Sell 13 failed when the secondary risk level at $142.88 was broken on a qualified basis (solid line). That left a Perfected Sell Setup (bar “9”) which did elicit a price reaction (on Friday) within the subsequent 1-4 bars. This leaves the chart in a pretty clear cut position: the Perfected Sell Setup calls for a new Countdown Sell 13 to complete, unless a Buy Setup (a “9” count to the downside) completes first. Friday was bar “1” of such a Buy Setup. Until and unless a Buy Setup completes, the presumption remains that daily trend is to the upside, especially if the price remains above the TDST Level Down line.
The QQQ weekly chart remains quite bullish. Friday’s drop was not enough to cancel the developing Sell Setup, which printed bar “8”. The Sell Setup will complete as long as next Friday’s close is above $137.84. If that occurs, a new Countdown Sell 13 will be expected to complete. If the Sell Setup does cancel, the chart will be left with a clean Countdown Sell signal (bar “13” from 4 weeks ago) with a secondary exhaustion level at $143.41. At that point $143.41 should be viewed as stiff resistance.
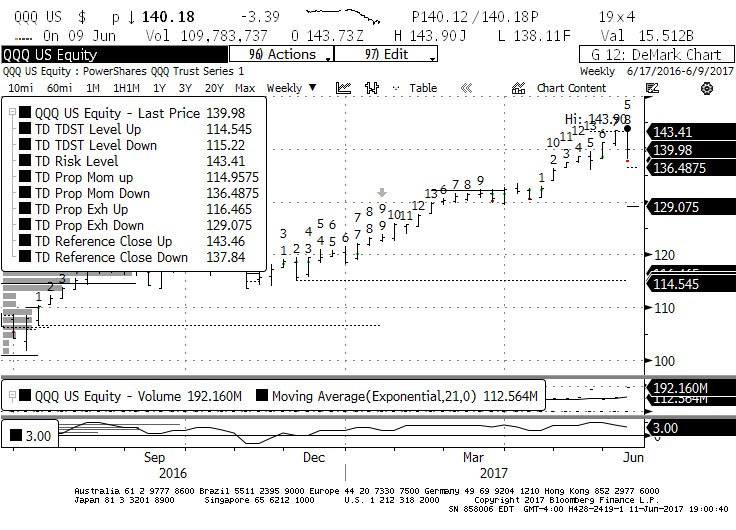
In sum, despite Friday’s drop, the onus remains on the bears to pick up the ball and run with it.
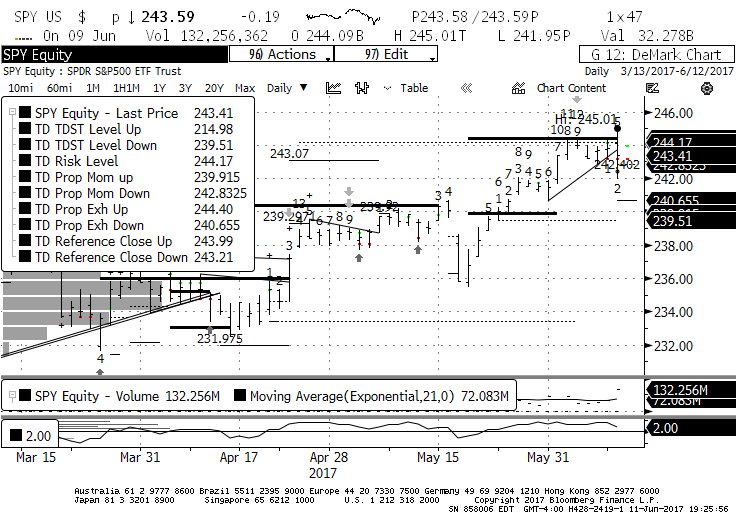
S&P 500 ETF (SPY)
The SPY daily chart is in a similar posture as the QQQ:
- A new Sell Setup 9 completed on June 5, and there’s now an expectation that a new Countdown Sell 13 will complete. Price did react to the downside on Thursday and If the developing Buy Setup (currently on bar “2”) completes, it will spoil the expectation of the new Countdown Sell.
- The TD Propulsion Exhaustion Up target at $244.40 was satisfied.
- The secondary exhaustion level at $244.17 from the last completed Countdown Sell 13 (back on April 25) has still not been broken on a qualified basis, and has already acted as resistance four different times.
- The latest Countdown Sell spun off by the Sell Setup “9” on May 2nd is on bar 12. If/when it completes it will print a new secondary exhaustion level to watch.
- TDST Level Down at $239.51 should serve as support.
ALSO READ: Crude Oil DeMark Update
On the weekly chart, the chart is almost identical to the QQQ. A new Sell Setup “9” will print next Friday if the SPY closes above $238.31, calling for yet another Countdown Sell to unfold. The Sell Setup 9 cancels (i.e. SPY closes below $238.31), the completed Countdown Sell with the secondary exhaustion at $248.06 will be the controlling count and we will have to wait and see if the trend change is confirmed by a complete Buy Setup “9” i.e. a “9” count to the downside.
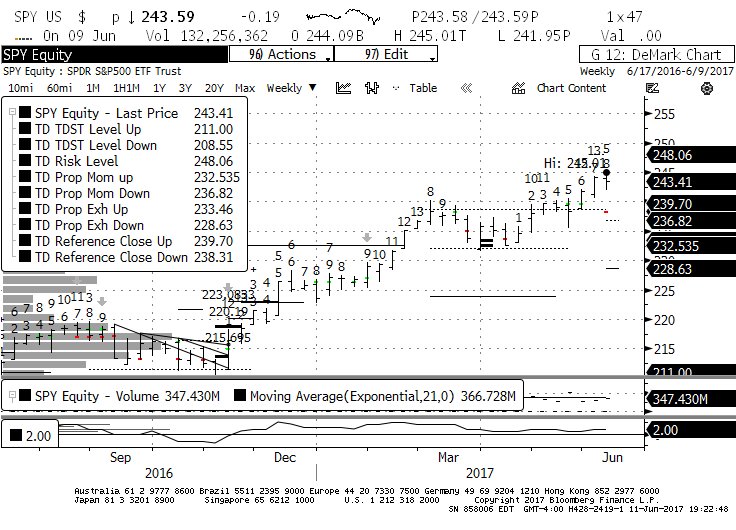
Here too the onus remains on the bears to prove their conviction.
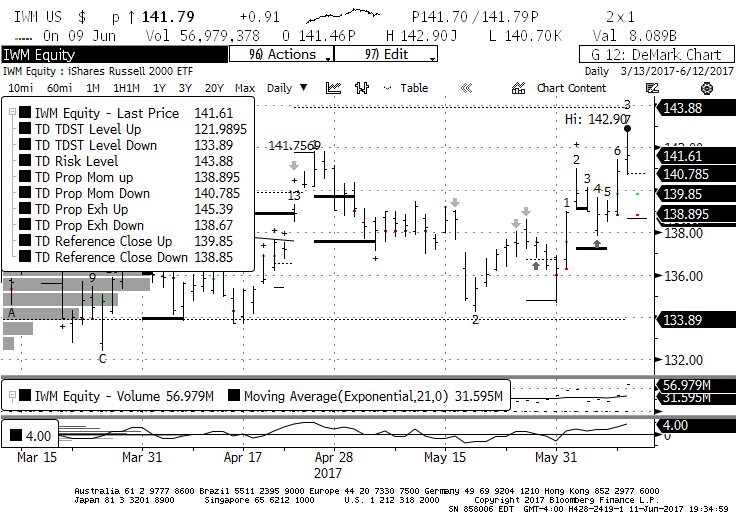
Russell 2000 ETF (IWM)
After acting trendlessly for weeks, the daily IWM chart has a chance to print a Completed Sell Setup 9 with a Monday close above $138.85, and a Tuesday close above $138.98. That will give credence to the view that a new leg higher has started for the IWM, especially if it can clear the current secondary exhaustion level at $143.88.
The weekly chart is also trying to perk up, even though the current Sell Setup is only on bar “2”, i.e. there is a ways to go before a Sell Setup can complete. In the meantime, the secondary exhaustion level at $146.42, remains the first order of business for the bulls.
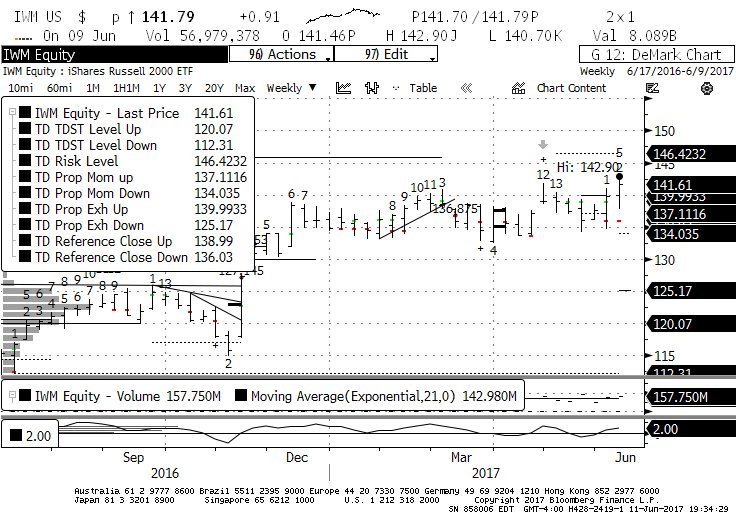
IWM bulls are trying to re-establish themselves after a period of meandering.
That’s where the three major indices sit as of Sunday night. Keep in mind that DeMark indices are not fortune-telling cards. They measure buy/sell exhaustion/pressure, and as such their message changes with the changes in prices. The way I use them is to give me a general sense of the field position of bulls and bears, not to try to pick absolute tops or bottoms. Hopefully, they will also help you navigate the noise of those predicting moonshots and crashes every other day.
Charts created by author using Bloomberg Finance.
Twitter: @FZucchi
The author has a position in SPY, QQQ, and IWM at the time of publication. Any opinions expressed herein are solely those of the author, and do not in any way represent the views or opinions of any other person or entity.


