Yesterday’s ugly action in crude oil has created some very notable – and bearish – setups on Crude Oil “DeMark” charts.
And this could have an effect on trading in the days and weeks ahead. Here’s an update using DeMark analysis across multiple time frames.
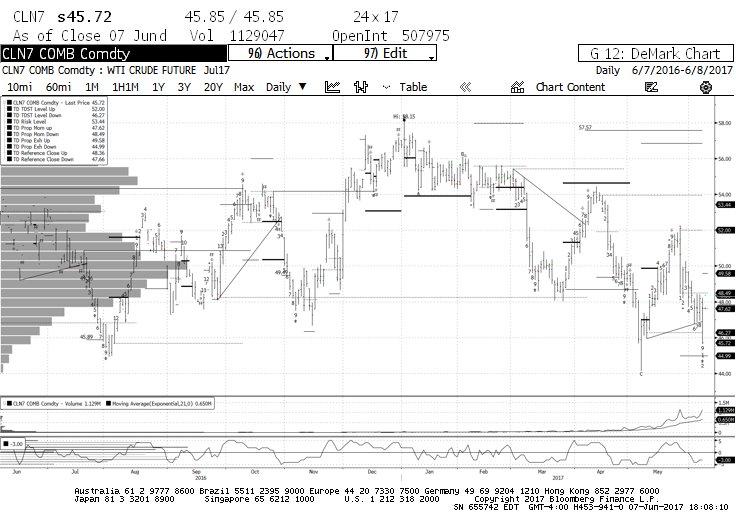
Crude Oil “Daily” Bar Chart
The daily chart shows a Perfected Buy Setup “9” below TDST Level Down. If today’s price prints a “lower open and lower low”, it will qualify the break of the TDST Level, putting in play the expected completion of a Countdown Buy “13” signal. TDST Setups – both DeMark Buy and Sell counts – have worked like a charm as turning points in the trading range that has trapped crude oil for the better part of the last year.
However, all but one of the Perfected Buy Setups in the last year completed ABOVE the TDST Level Down line. In the instance when the count completed below that line, the level break was never qualified. If the break does qualify today, it will frame the chart in a far more bearish posture than in the past 12 months.
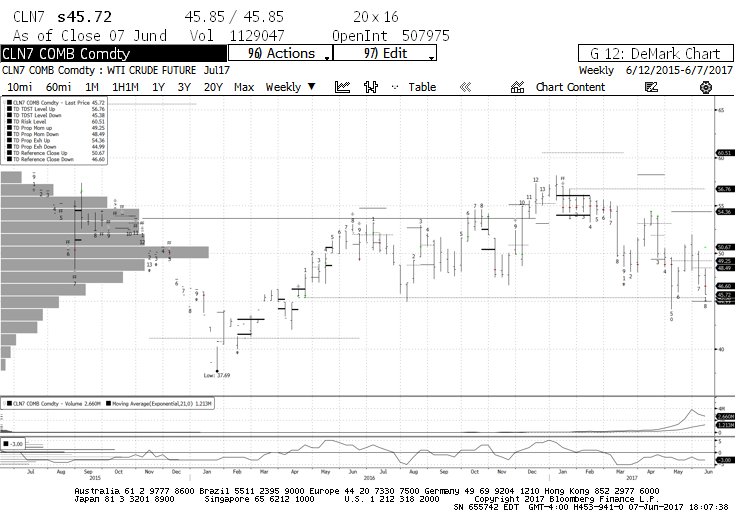
Crude Oil “Weekly” Bar Chart
On the weekly chart, the price is hovering just above the TDST Level Down at $45.38. The Countdown Buy signal is on bar “8” which usually serves as a low/throwback point before a final stab down. In other words, there are two levels of support “right here and now”. If price does not respond, and the TDST Level Down is broken on a qualified basis, it would put into serious question the long-standing broad trading range ($42-58) of the last few years, and open the door to a retest of the lows in the mid-$20s.
I have never traded the crude oil contract – and never will – but if I were to, right now it sets up like a VERY interesting time.
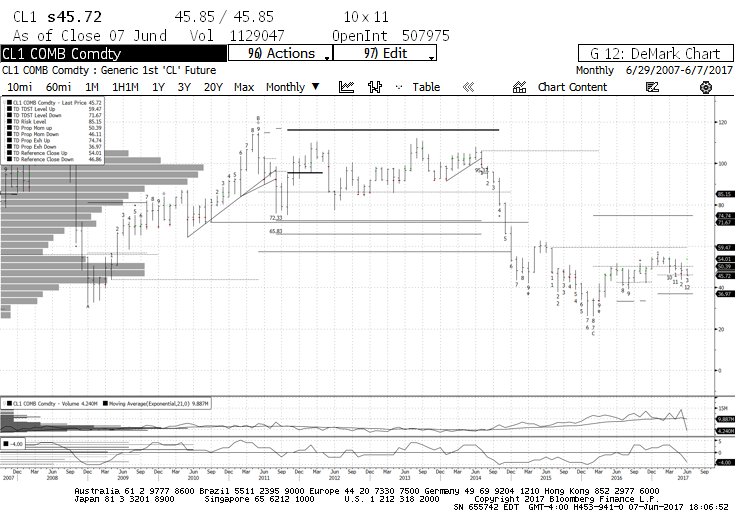
P.S. Because of the nature of commodity contracts and how they roll monthly, the daily and weekly charts shown here are of the current active contract, while the monthly chart is of the “continuous contract”. The latter is not as reliable as the former and is shown below.
Thanks for reading and good luck out there!
Note that the charts were created with Bloomberg Finance.
ALSO READ: Credit Market Update: The Bull Rages On
Twitter: @FZucchi
Any opinions expressed herein are solely those of the author, and do not in any way represent the views or opinions of any other person or entity.

: Showing Some Signs of Emerging Strength")
