Click HERE to read Part 1 of this article.
Before progressing, it is worth revisiting Stoking The Embers of Inflation, a paper we wrote with Brett Freeze in 2018. At that time, the money supply was declining, and we argued, contrary to popular thinking, it might generate more inflation. In the months that followed, annual CPI rose to 2.90%, the highest level since 2012. Today, we argue a sharply rising money supply may not generate much inflation.
Confused?
In Part 1 we wrote: “The truth lies in the supply and the demand for money. Unfortunately, the supply of money gets the headlines, while its demand is an afterthought.”
This article’s underlying theme, and the one described in depth in the article mentioned above, is the Monetary Exchange Equation. The equation explains how money supply and monetary velocity determine price trends.
Supply Demand Curves
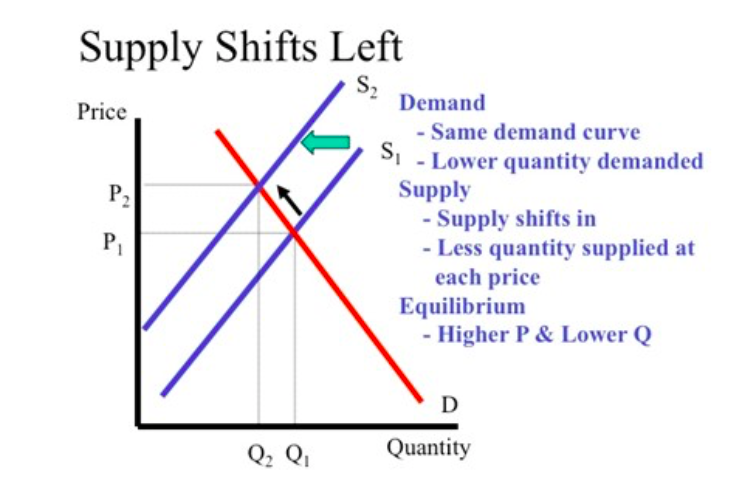
Economists use supply-demand curves to visualize how a shift in the supply and/or demand for a good affects prices. As shown below, reducing the production of goods shifts the supply curve to the left. Since demand remains constant in this case, the price rises (P1 to P2). The example is Econo-speak for “the less of something there is, the more its worth.”
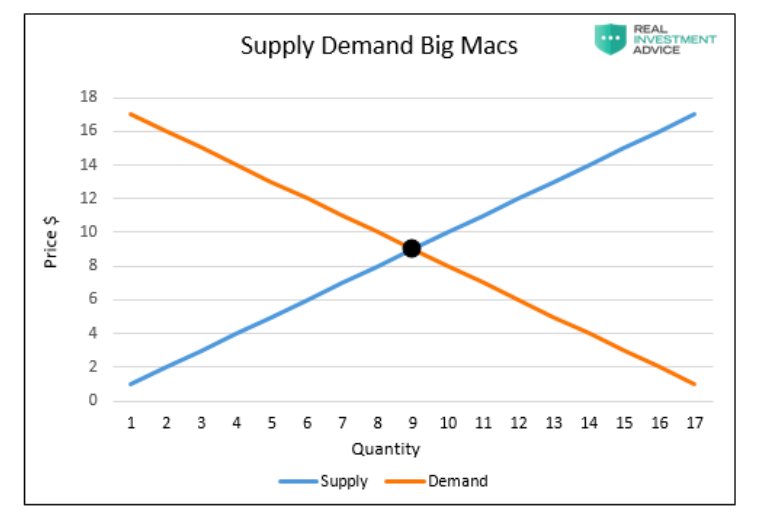
The cost of beef, factory capacity, labor prices, and thousands of other factors influence the supply of Big Macs. Its demand curve shifts with the prices of other goods, wages, tastes, and many other factors.
Federal Reserve actions and, equally important, the demand for debt and the banks’ willingness and ability to lend greatly impact the supply of money. All money starts as debt. As such, new debt increases the money supply while debt defaulted upon decreases the supply.
The demand for dollars, also known as velocity, is driven by the aggregate desire to save or spend money. Velocity is essential in determining prices and yet is most often neglected. To better understand velocity, we recommend reading: The Fed’s Inconvenient Truth: Inflation is M.I.A.
How the Dollar Affects the Price of a Big Mac
We present the diagrams below to show the interaction of a Big Mac’s price to shifts in the supply and demand for money. As noted in Part 1, from a macroeconomic view we only care about prices in aggregate. Big Macs in the charts below represent the aggregate price change for all goods and services.
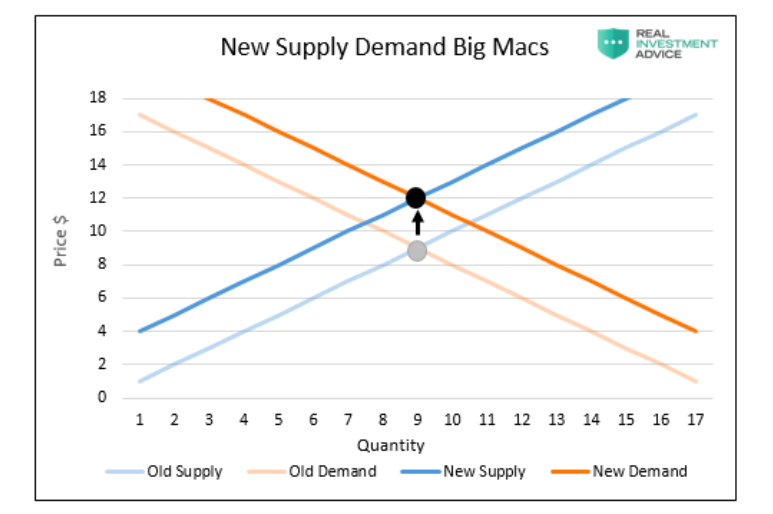
As shown below, the supply and demand for Big Macs are influenced by many factors. Any change in supply or demand will shift either or both curves, resulting in a new price (black dot).
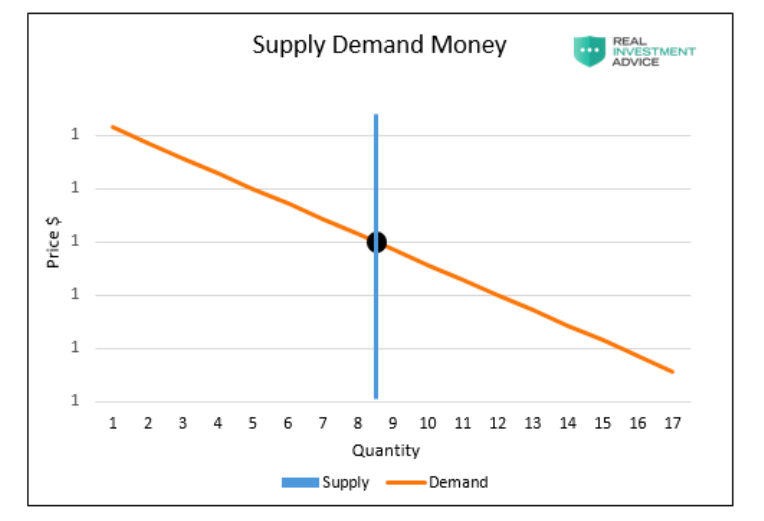
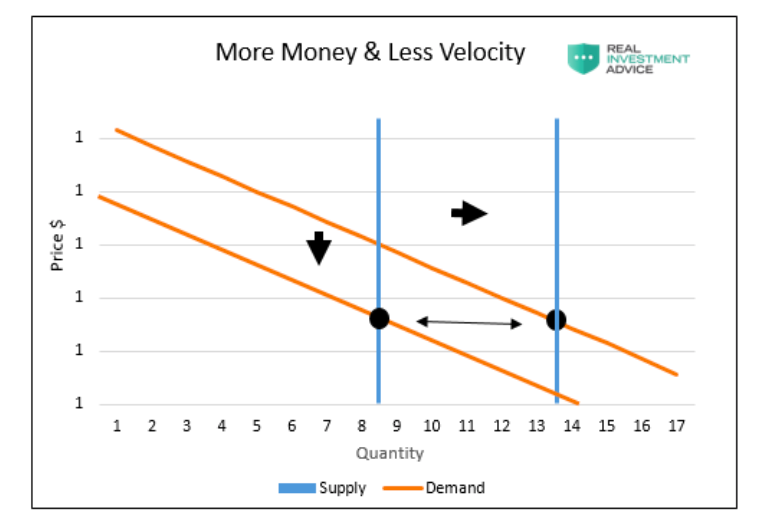
The supply and demand curve for money, shown below, is not the more common “X” pattern. First of all, the y-axis, or value of money, is always 1. Also, the supply of money is a vertical line, meaning it is inelastic. Supply is not swayed by price, but instead, it shifts on the Fed and banks’ actions. Shifts in the demand line (monetary velocity) are based on interest rates and the change in spending and saving habits.
The following graph shows how supply (blue) shifts right when the money supply increases. This should result in a lower price for money. However, the price of money does not change, so any change is reflected in higher aggregate prices for all goods and services. Remember, “cheapening” of the dollar does not mean it has a lower price. Instead, it shows up as higher prices of goods and services. To repeat, a dollar is always worth a dollar.
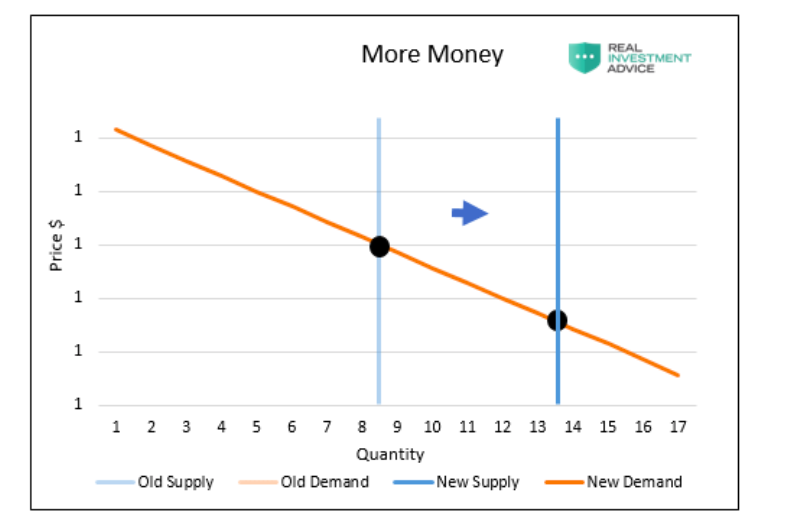
Since a dollar is always worth a dollar, a Big Mac’s price adjusts for the change in the graph above. The Big Mac (all goods) supply/demand lines shift upwards in a similar fashion. The result is inflation. If demand fell due to higher prices, the orange curve would shift left, resulting in a lower price.
Today’s Money Curves
The following graph illustrates what is happening today. As shown below, a decline in demand (orange-velocity) is offsetting the increase in the money supply (blue). With less money circulating through the economy, it is as if the quantity of money never changed.
Velocity Matters
On its own, an increase in the money supply is inflationary. However, an equal decline in the demand (velocity) for money completely offsets it, resulting in no change in aggregate prices.
The media and those hyping inflation tend to solely focus on the supply of money. Rarely do we hear mention of monetary velocity. We revisit the graph below to show the surge in money supply is nearly perfectly offset by the decline in velocity.
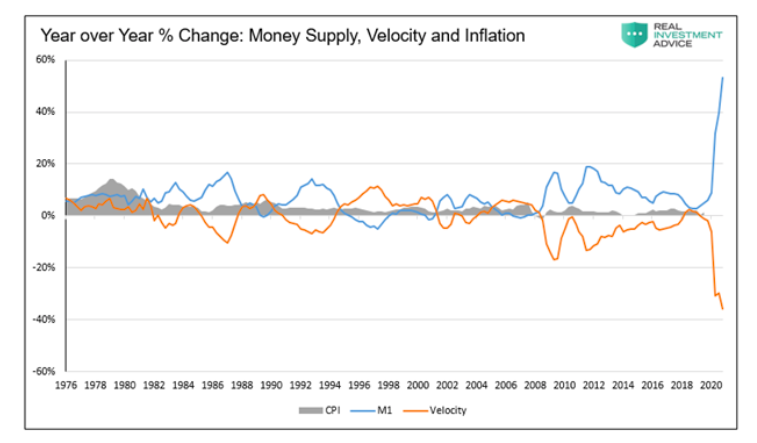
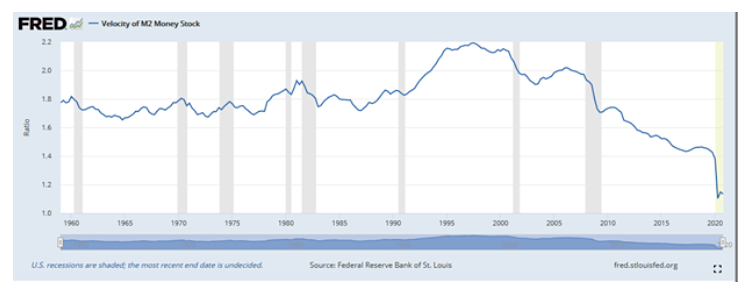
The velocity of money has been in a downturn for the past 25 years. It is occurring due to excessive debt levels, low productivity growth, and poor demographics. The result is declining economic growth.
Looking forward, the surge in unproductive COVID-related debt and more leverage in the system will further impede monetary velocity. Temporary blips higher in inflation are possible due to supply line problems and fiscal stimulus, but the long-term outlook remains disinflationary for the time being.
Summary
Inflation, measured as the aggregate prices of all goods and services, is a function of the supply of money and its velocity. Productivity growth, demographics, and debt trends lead us to believe velocity will continue to counterbalance increases in the money supply. Unless the Fed changes its operations and truly prints money, we must assume prior price trends will extend forward.
Supply line problems and bouts of strong demand due to fiscal stimulus can and will create very short-term bursts of higher prices. However, there is little from a macro perspective to persuade us that long-term inflation is in our future. If our opinion changes, we will promptly inform you.
Twitter: @michaellebowitz
Any opinions expressed herein are solely those of the author, and do not in any way represent the views or opinions of any other person or entity.


: Showing Some Signs of Emerging Strength")
