Under Armour (NYSE:UAA) is now on my trading radar. After breaking important support around 31.64, Under Armour stock price is nearing a buy zone around $26-$28.
Again, this is all based on probabilities. Personally, I like Under Armour’s products but I have very little idea about their fundamentals or go to market strategy. I simply look at chart patterns based on mathematics and highlight potential entry levels for both longs & shorts.
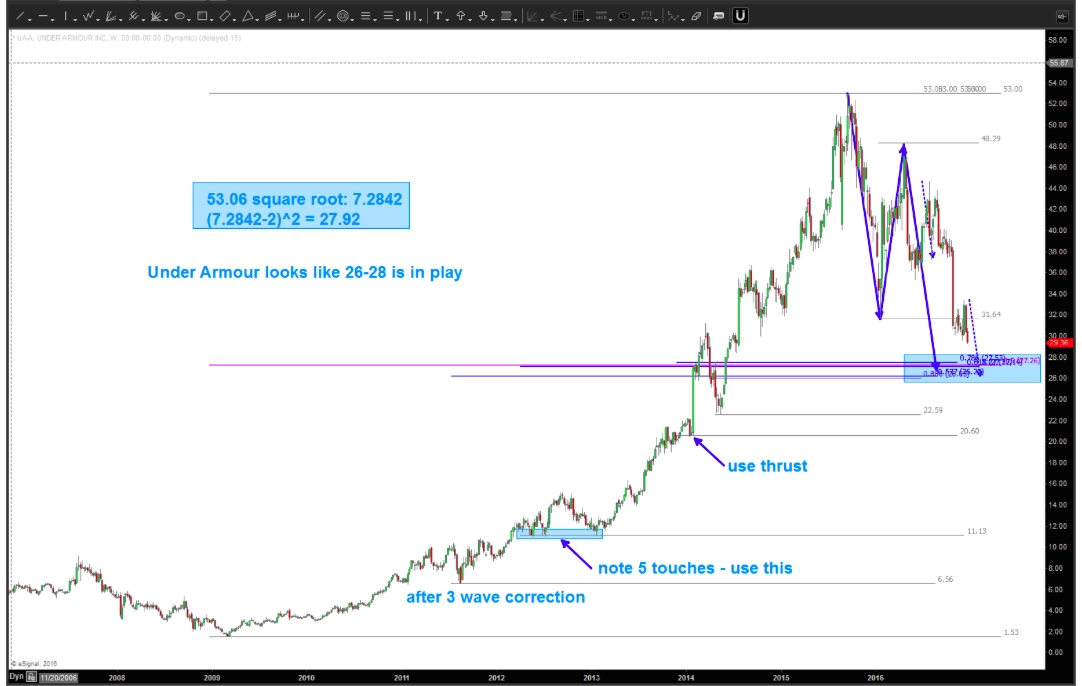
Okay, so let’s look at why Under Armour stock is interesting here. There are a lot of numbers coming together in one area ($26-$28) – see chart below. This price area should act as support and allow for an upside trade. At a minimum, it offers a defined place to go long with a stop.
In my opinion, a daily close below $25 would indicate that this pattern has failed.
Under Armour “Weekly” Stock Chart
Back in October, I commented on the possibility of Under Armour reaching its lower price targets. Here’s what I wrote:
-
this is the first ‘true’ BUY pattern since it’s IPO and after a spectacular and somewhat parabolic run.
-
caution w/ the size of the candles coming down – that denotes thrust and patterns fail when huge thrusts hits the levels
-
note the square root target hits – basically – right at the BUY pattern. That, my friends, is good.
- remember, the square root target is using the Gann Square of 9. One trip around the wheel is equal to the square root of the base number (in this case the high of 53.06) -2 and then resquared. That’s how it works.
-
the second chart is a long term log look at UA. NOTE – it broke it’s fabulous run .. so, this selling pressure is expected. that’s what happens when long term log trend lines are broken.
this pattern fails – IMHO – with a daily close below 25.
Thanks for reading and have a happy new year.
Twitter: @BartsCharts
Author does not have a position in mentioned securities at the time of publication. Any opinions expressed herein are solely those of the author, and do not in any way represent the views or opinions of any other person or entity.


