Near the end of 2016 a BUY pattern presented itself on the Under Armour (NYSE:UAA) stock chart and I communicated that here.
Chart patterns are all about probability and some work, while some don’t. But the math is usually good at highlighting inflection areas.
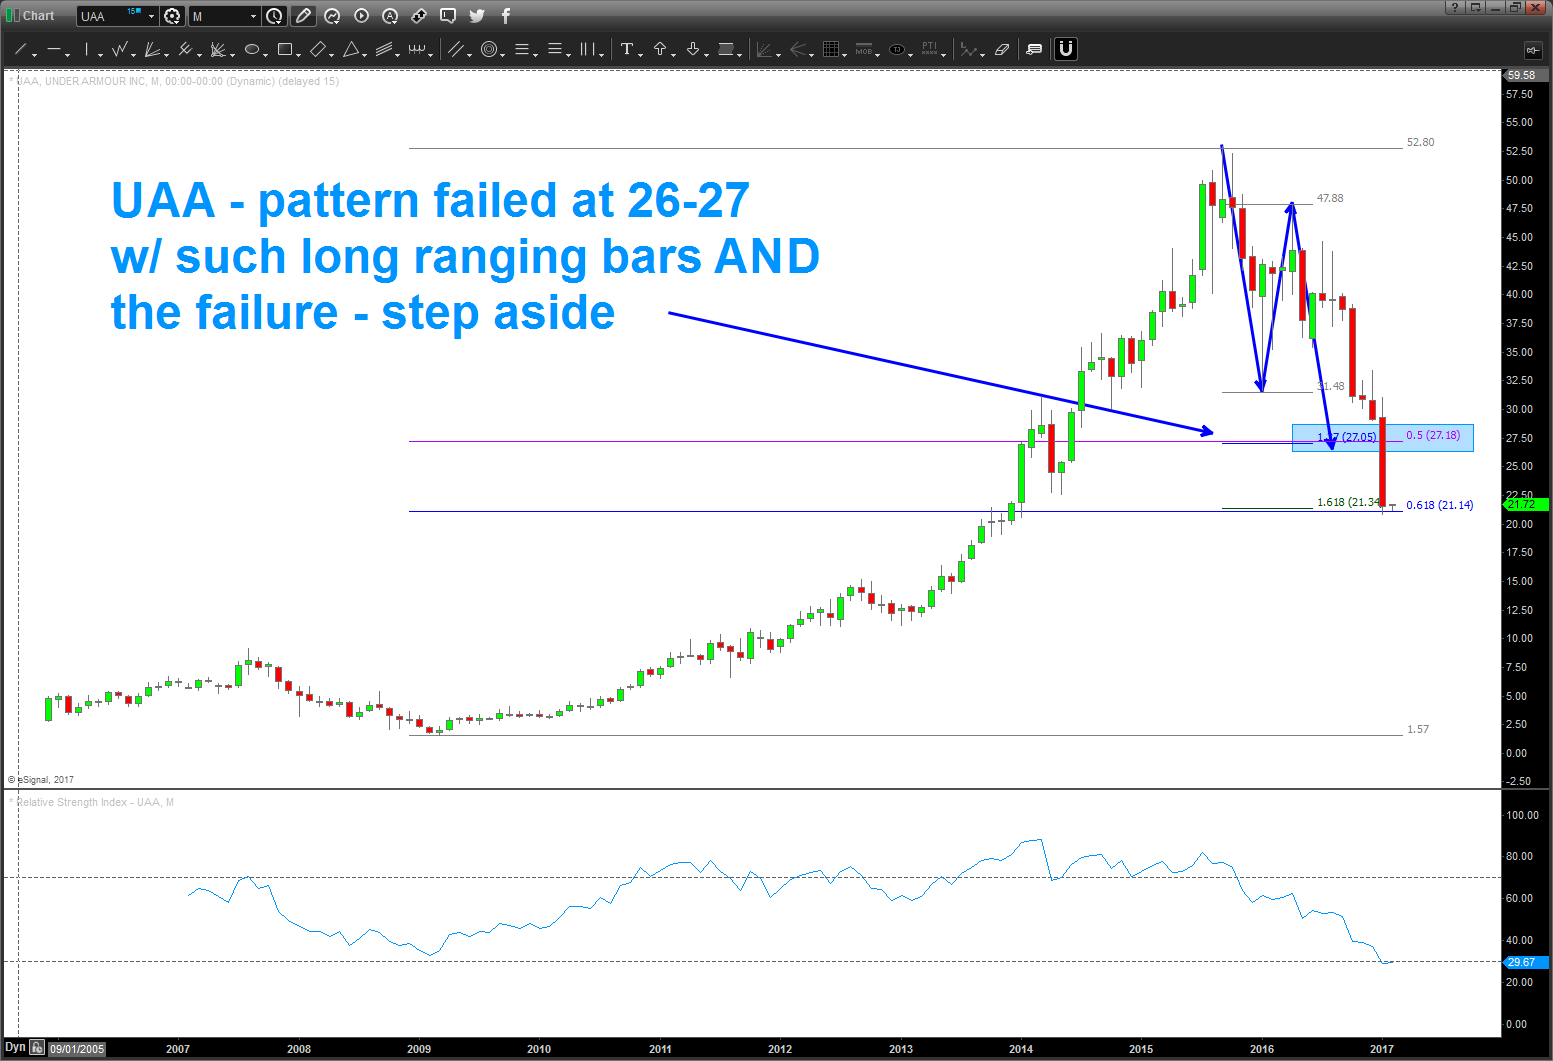
The buy pattern identified $26-$28 as a buy zone. The stock briefly dipped near $28 and change but hovered just above the buy target zone into Monday’s quarterly earnings report.
Well, earnings were NOT good. And immediately following their earnings release, the pattern failed – gapping right through the target zone. The stock is currently finding some support at the next logical price level.
I share this update as I want to show the ones that work as well as the ones that don’t. It’s all probability. And when patterns fail, they often fail like the UAA chart below. Probably best to step aside…
Under Armour (UAA) Stock Chart – Pattern Fails
Until the next time a pattern emerges, happy trading!
Twitter: @BartsCharts
Author does not have a position in mentioned securities at the time of publication. Any opinions expressed herein are solely those of the author, and do not in any way represent the views or opinions of any other person or entity.

 Flirting With Critical Support… Again")


