After a trending decline that was stronger than expected, and with FOMC scheduled this week, we are watching for a possible bounce from a support area in treasury bond futures and the iShares 20+ Year Treasury Bond ETF (NYSEARCA: TLT). Today we put the spotlight on the $TLT US treasuries Elliott wave forecast chart.
TLT’s treasury bond price seems to be trying to form some type of motive wave down from the 2020 high, although we believe this year’s downward move might not be forceful enough to become an Elliott wave impulsive pattern.
A downward leading diagonal seems more likely, but either scenario would produce a five-wave downward structure.
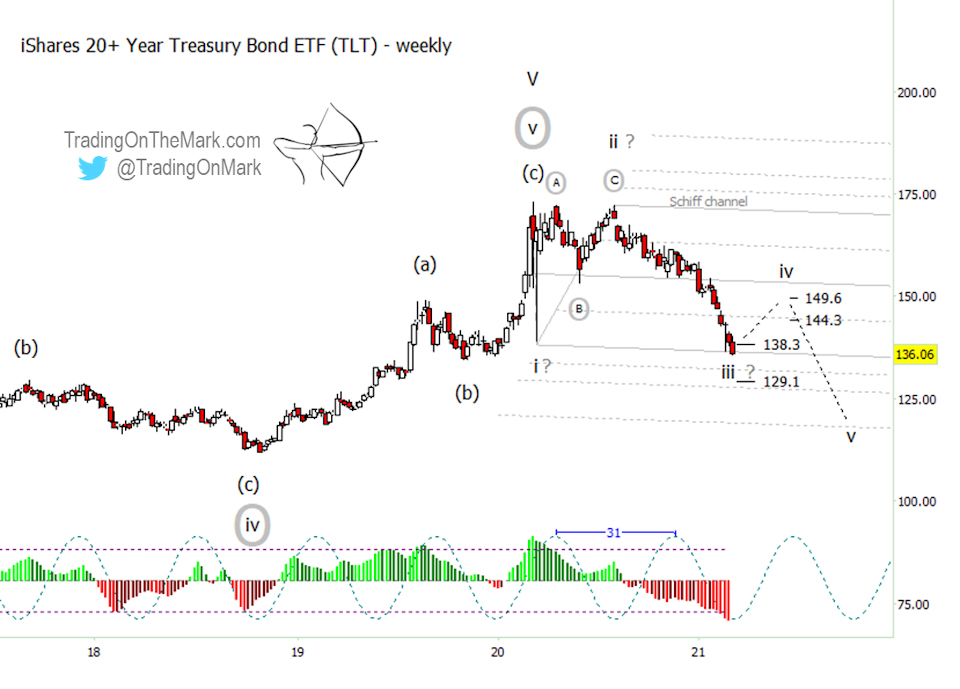
Currently TLT is testing the support at the boundary of a Schiff channel. From here, the first confirmation of a minor wave ‘iv’ bounce would be a weekly close above the prior support at 138.30.
On the other hand, if price fails to find support nearby, then it could test the next stepping stone down at 129.10.
$TLT – iShares 20+ Year US Treasury Bond ETF Chart
A leading diagonal pattern is characterized by overlap between the first and fourth waves, and a TLT bounce from the current area certainly would have overlap. Based on that scenario, standard retracement measurements suggest TLT could see resistance near 144.30 and possibly 149.60.
Trading On The Mark provides detailed, nuanced analysis for a wide range of markets including crude oil, the S&P 500, currencies, gold, and treasuries. Visit our new page on Substack and follow us on Twitter for more market updates.
Twitter: @TradingOnMark
The authors may have a position in the mentioned securities at the time of publication. Any opinions expressed herein are solely those of the author, and do not in any way represent the views or opinions of any other person or entity.


