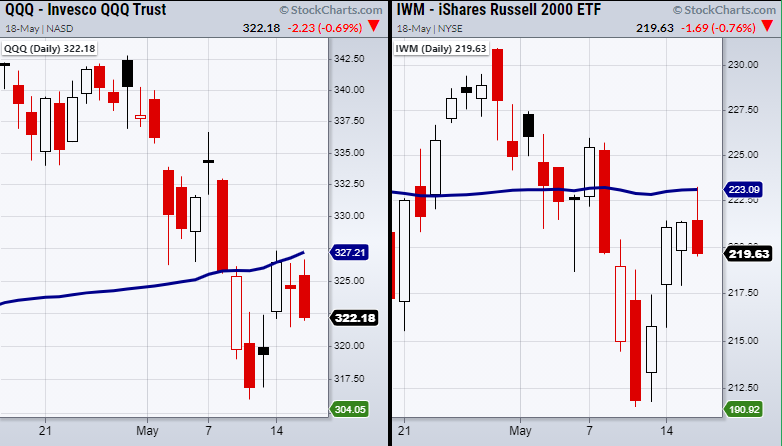
The Russell 2000 (IWM) and Nasdaq 100 (QQQ) have yet to clear over their 50-Day moving average which has created a pivotal and psychological resistance level that bulls are looking to clear.
Additionally, other key sectors and indices have been holding their breath in anticipation of a break over these specific price points.
The S&P 500 (SPY) and the Dow Jones (DIA) along with the Transportation (IYT) and Retail (XRT) sectors closed Tuesday with relatively thin trading ranges when compared to last week’s price action.
On top of that, the daily volume in these symbols has decreased from the bounce off the lows on 5/12.
This shows buyers and sellers are not fighting each other, and instead are trading with more caution and less size.
However, while weaker amounts of volume can be seen from a negative standpoint, the overall price is still holding, and sellers have not jumped in the mix.
Furthermore, if we look at the fear gauge or the S&P 500 VIX Short-Term Futures (VXX), it is also experiencing consolidative price action.
Without a doubt, investors are still worried and are not completely convinced the market will successfully be able to clear key resistance and hold it.
This can make securities trading tough when the market is processing its next move.
On the other hand, due to increasing inflation, our commodities trades such as Gold (GLD), Silver (SLV), and Sugar (CANE) have steadily moved higher without much hassle from the overall market.
This is because the commodities space still presents opportunities with inflation set to rise going into 2022+ and offers safety plays based on demand that is increasing now that the U.S is moving back towards pre-pandemic times.
To see updated media clips, click here: https://marketgauge.com/media-highlights-mish/
Stock Market ETFs Analysis & Summary:
S&P 500 (SPY) If cannot hold 410. Then 406 next.
Russell 2000 (IWM) Support 215. Resistance 223.19.
Dow (DIA) 345 support.
Nasdaq (QQQ) 327 resistance.
KRE (Regional Banks) 71.82 resistance.
SMH (Semiconductors) 233 pivotal area. 222.82 support.
IYT (Transportation) 282.40 resistance. 267.92 support.
IBB (Biotechnology) 147.11 support. Could not hold over the 50-DMA.
XRT (Retail) 96.27 resistance.
Twitter: @marketminute
The author may have a position in mentioned securities at the time of publication. Any opinions expressed herein are solely those of the author and do not represent the views or opinions of any other person or entity.

: Worrisome to Broader Market?")
