S&P 500 Trading Outlook (2-3 Days): Bearish
The first signs of near-term trend damage for S&P 500 Index (INDEXSP:.INX) came yesterday, while the Dow Jones Industrial Average (INDEXDJX:.DJI) could also confirm Daily counter-trend DeMark sell signals with a close under 23338.36 (current levels).
Looking at the S&P 500, initial price support lies down near 2490-2500. But this could get worse into mid-November (cycles) before any real bottom. I’m thinking that further downside is likely, so I’ll use today’s bounce attempt as an opportunity to lighten up and/or consider adding to implied volatility longs.
The daily chart shows yesterday to be the first real sign of trend damage from the August lows (a trend line breakdown along with confirmation of Counter-trend exhaustion per Demark indicators). Here’s a look after Wednesday’s close:

Additional selling in SPX looks likely in the weeks ahead, even if prices attempt to bounce on Thursday/Friday. Wednesday’s decline appears to have started the process for stocks turning lower, at a time when many likely least expect it. I’m also keeping a close eye on the Industrials (which reversed sharply yesterday) along with Technology and Financials.
TECHNICAL THOUGHTS
Yesterday brought about the first real sign of trend damage in the indices since late August with the SPX making multi-day low close, while both DJIA and NASDAQ Composite slipped to at least new two-day lows, with SPX damage being sufficient to confirm its counter-trend exhaustion “sell”. Breadth finished around 3/1 negative, which was better than earlier 5/1 levels, but still not encouraging for the Bulls, as momentum dipped further as breadth took another leg down. This looks to be the start of the long awaited correction as multiple sectors and indices turned down to multi-day lows at at time when momentum and breadth had already begun to weaken. While a two-to-three day bounce can’t be ruled out from a Counter-trend perspective, which would help other sectors and indices to trigger their own signs of exhaustion (S&P Financials for example, and/or Treasury yields on further yield rallies) the market looks to have tipped its hand on Wednesday, and unless a VERY sharp rebound happens with broad-based participation, which looks unlikely, the trend should begin to work its way lower, slowly at first, but increasingly with more participation.
Looking back, signs of reversals were present in sectors like XLF, XLI, XLK and XLB, XLE, while others that had been trading off their highs moved lower to multi-week or monthly lows, such as the Consumer Staples ETF, XLP. Every one of the 11 sectors finished down on the day with five sectors: Energy, Industrials, Financials, Materials and Telecomm, ending the day down more than -0.50%. Financials reversed course despite the big move in Treasury yields higher above 2.40% and despite pulling back a bit, as equities sold off, the Treasury selloff very well might extend a few more days before turning back lower.
Three key factors tilted the odds towards selling getting underway sooner than later.
First, implied volatility started to trend up sharply, following suit with SPX gains.
Second, Breadth began to turn down over the last week which was largely inconspicuous when looking at index gains. (DJIA hitting records, but breadth was flat and largely was made up of gains from 3 stocks).
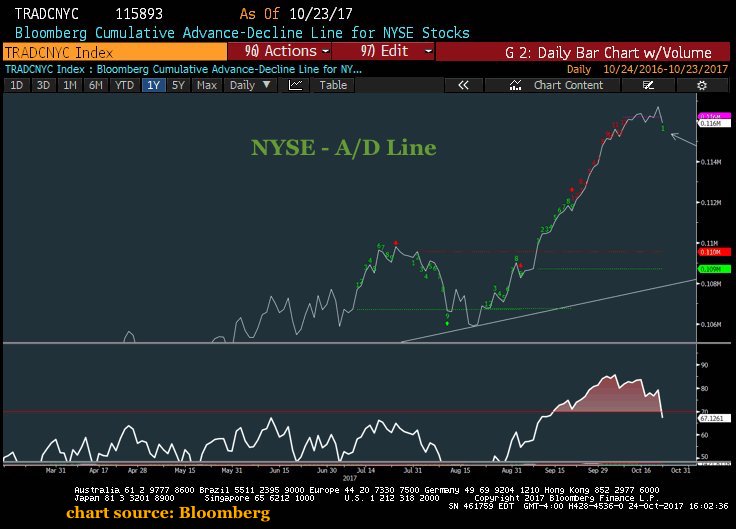
Third, New lows began to trend up sharply, with NYSE registering 37 new lows prior to yesterday’s decline (see chart below).
Other factors like momentum turning down were important but typically do tend to happen when price flattens out after a large upswing (like what we saw from late August). In this case, MACD turned negative for SPX last week given the flattening out. Overall, additional selling looks likely as a result of these factors coupled with sentiment, cycles and counter-trend signals of exhaustion.
If you are an institutional investor and have an interest in seeing timely intra-day market updates on my private twitter feed, please follow @NewtonAdvisors. Also, feel free to send me an email at info@newtonadvisor.com regarding how my Technical work can add alpha to your portfolio management process.
Twitter: @MarkNewtonCMT
Author has positions in mentioned securities at the time of publication. Any opinions expressed herein are solely those of the author, and do not in any way represent the views or opinions of any other person or entity.
: Creating Bullish Divergence?")


 and Semiconductors (SMH): Concerning Price Pattern?")


