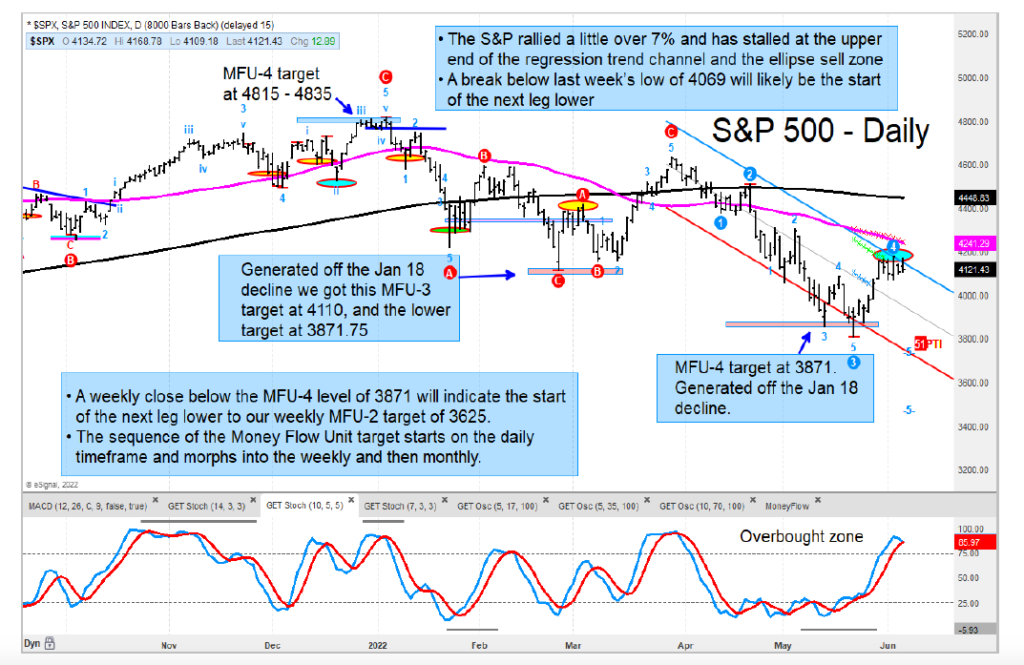
The major U.S. stock market indices are trading up into selling zones and remain in their dominant longer-term downtrends until proven otherwise.
I recently put out a sell signal (short) on the long-dated treasury bond etf (TLT) and highlighted that this trade could see TLT fall another 15% or so.
The 10-year treasury bond yield is about to break above our MFU-3 target of 3.03, which will then open the upside to our long-term target of 4.29. Yikes!
Also, the U.S. Dollar trading pattern is long-term bullish. The setup right here looks great for a long position for those interested. This is one of our top picks in the global macro alpha capture portfolio I run.
Some energy stocks are still quite bullish with great technical patterns. WTI Crude Oil remains in a firm uptrend. We remain confident that our MFU-5 price target of $127 is in play.
I also created an equal-weighted index of AAPL, AMZN, FB, NFLX, and GOOG. This index has been in a strong downtrend and recently was down –40% from the 2021 high. Our Money Flow Unit analysis has a downside price target that is much lower from here.
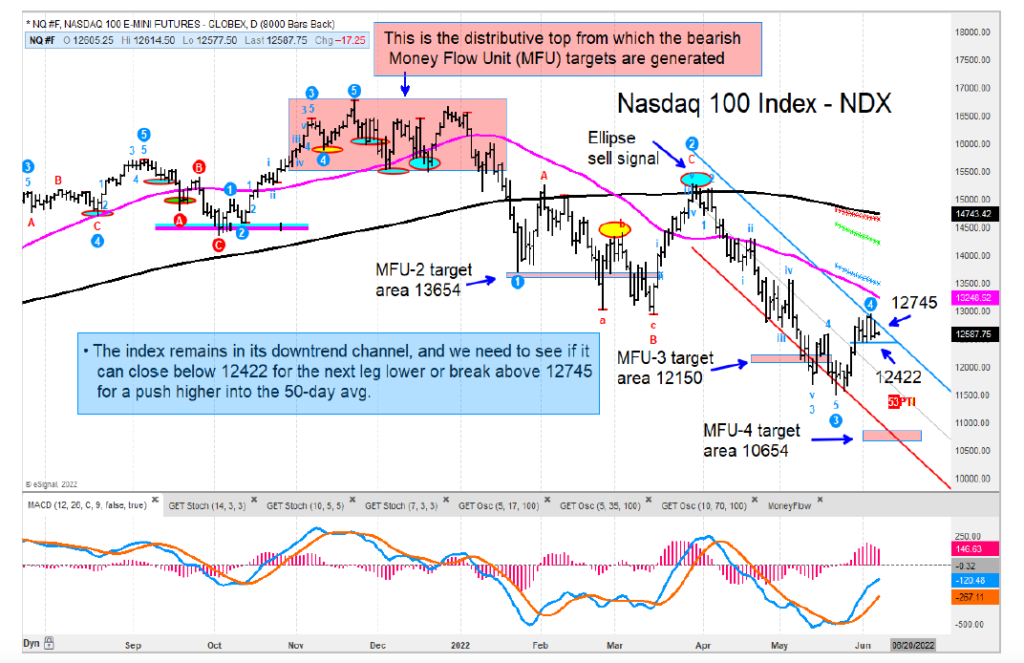
Below is a look at the Nasdaq 100 Index:
Twitter: @GuyCerundolo
The author or his firm have a position in mentioned securities at the time of publication. Any opinions expressed herein are solely those of the author, and do not in any way represent the views or opinions of any other person or entity.
: Creating Bullish Divergence?")


 and Semiconductors (SMH): Concerning Price Pattern?")


