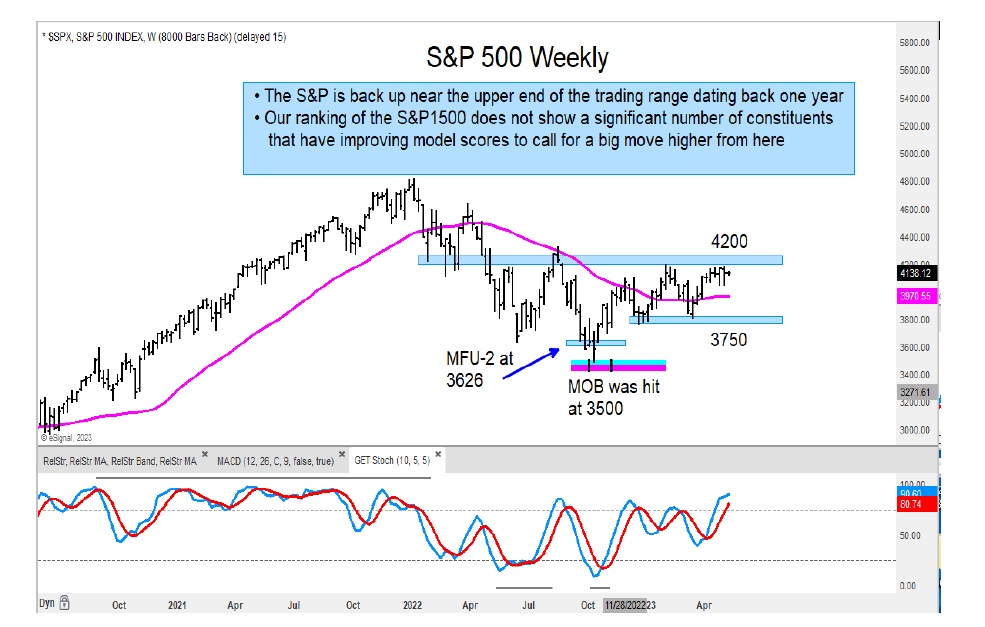
Our scoring of all the stocks in the S&P 1500 continues to find the majority of the constituents 71% with a weak model score.
And, at the same time, the S&P 500 is trading near the upper end of its sideways range.
The last time the percentage of the S&P 1500 had this many weak-scoring stocks was at the October 2022 low with a reading of 75%. This illustrates the narrowness of the advance.
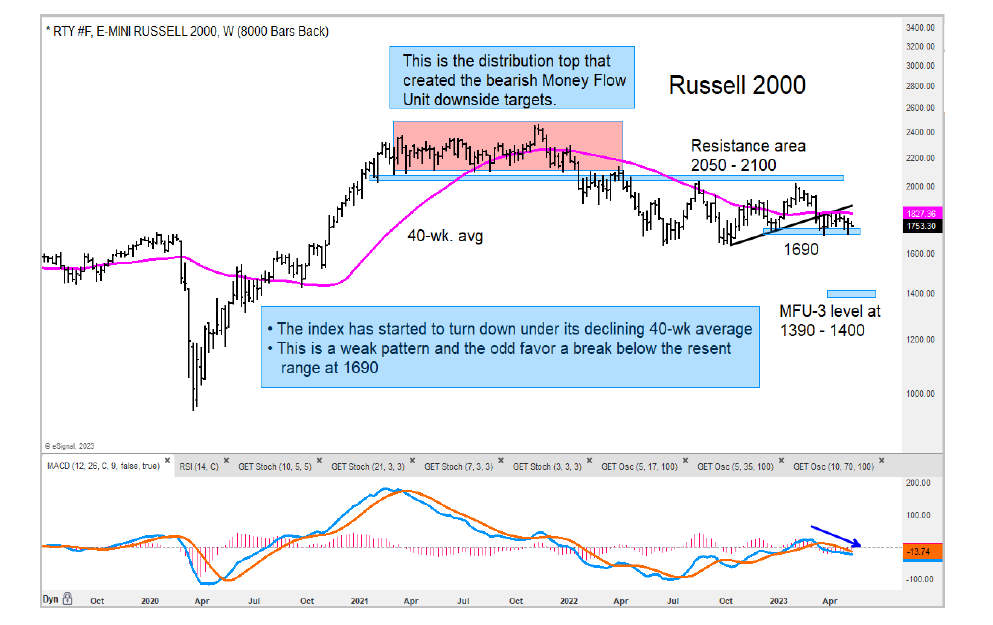
The Russell 2000 has turned down on a weekly basis and looks poised to break the recent lows at 1690. Careful here.
The technology sector has been the strongest scouring sector, and this is reflective of the strength in the Nasdaq 100 Index (NDX). The index has rallied up into MOB target band resistance, so this is a zone to look for a pause at best.
Lastly, Gold is bumping up against its 2-year high. We are on watch for a breakout above $2080.
Twitter: @GuyCerundolo
The author or his firm have a position in mentioned securities at the time of publication. Any opinions expressed herein are solely those of the author, and do not in any way represent the views or opinions of any other person or entity.


