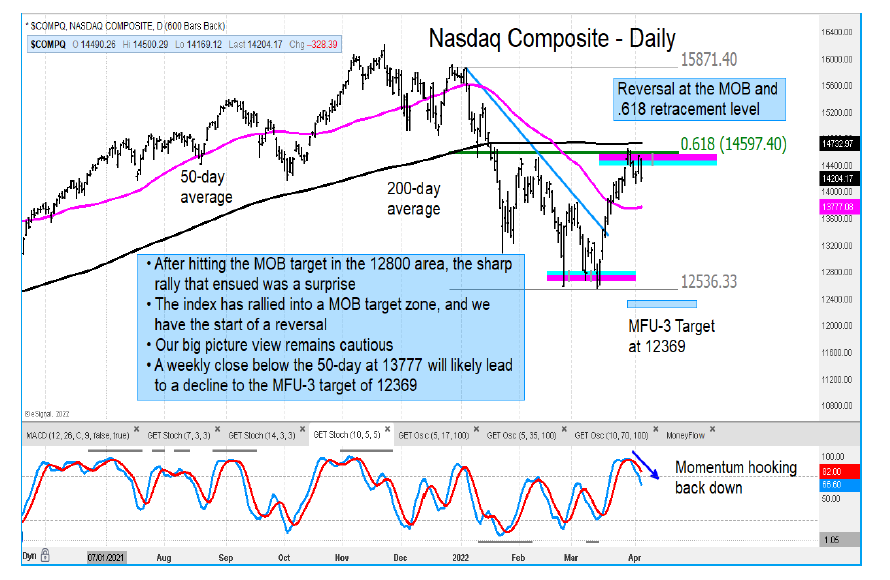
The broad stock market indices are running into some volatility.
The Nasdaq Composite, S&P 500, Nasdaq 100, and Russell 2000 have all rallied into resistance areas marked by either an ellipse, MOB band or .618 Fibonacci retracement area as resistance.
My research shows that the Russell 2000 is the weakest of these stock market indices. We remain cautious on these markets reviewed.
WTI Crude Oil has pulled back to trend support. I expect a move higher from here.
The MSCI All Country World Index has rallied back into a significant price resistance area. This is a good picture of the developed global markets, which is negative.
Twitter: @GuyCerundolo
The author or his firm have a position in mentioned securities at the time of publication. Any opinions expressed herein are solely those of the author, and do not in any way represent the views or opinions of any other person or entity.

: Worrisome to Broader Market?")
