August was a month of reduced activity in financial markets, as many market participants take vacation before the start of the school year.
Everyone is back to their normal routine and geopolitical worries such as North Korea continue to simmer. The rising geopolitical concerns at home and abroad, however, have been met with a steady trickle of positive employment and economic growth.
At present, the overall macro trend for equities and the S&P 500 (INDEXSP:.INX) is positive.
Stocks & Bonds
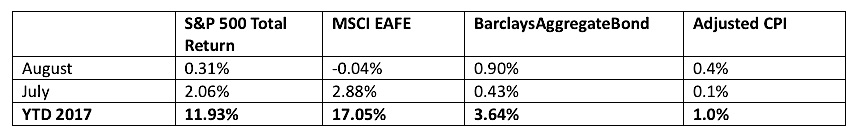
The U.S. stock market continues its upward trajectory (see August monthly numbers below). Healthcare reform is bogged down again in Washington, but the market seems to think that tax cuts will be an easier target for the current administration.
Geopolitical worries have helped bonds outperform equities. The elephant in the room is the Fed and its imminent unwinding of QE. Here are the numbers:
Commodities & Currencies
Oil prices dropped almost 6% in August, as hurricane season closed many gulf-coast refineries, leaving oil producers with fewer buyers. For the year prices are down over 12%. The safe-haven of gold saw increased interest as North Korea and Trump jawbone with each other, raising fears of war. Gold rose almost 4% in August, bringing its year gain to almost 15%.
The U.S. dollar extended its losses in August, and is down over 9% for the year against a trade-weighted basket of currencies. Many market prognosticators had anticipated a year of dollar strength on the back of interest rate increases, so the reversal in dollar fortunes has caught some off-guard.
Economy
The ISM Manufacturing PMI in August came in at 58.8%, stronger even than July and showing the 99th straight month of economic expansion. The non-manufacturing, or services, index came in at 55.3%, also showing continued expansion. The Commerce Department released its second estimate of second quarter growth, updating their estimate from 2.6% annualized growth to 3.0% growth.
The National Association of Realtors reports that existing-home sales in July 2017 were 0.2% lower than in July 2016. However, the median price rose 5.6% to $253,500 from a year earlier. Median home prices have now been rising for the past 65 months. Distressed sales (foreclosures and short-sales) were just 4% of total sales in July, down from 5% a year ago.
Commentary
After the financial crisis of 2008, the Federal Reserve printed almost $3.5 trillion dollars to stimulate the economy. This is technically called ‘Quantitative Easing’ rather than ‘money printing.’ They did this in 3 major operations – QE1, QE2 and QE3. This chart shows the profound effect this had on the stock market (the line is the S&P 500 – shaded areas indicate Fed interventions):
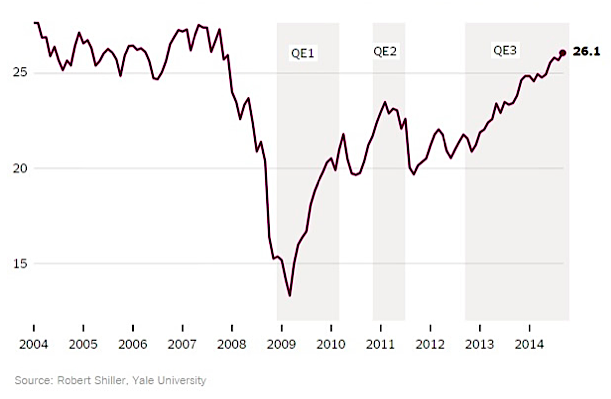
Since the end of QE3, the Fed has been reinvesting maturing bonds each month, so basically the financial markets have had a revolving loan. Starting in October, the Federal Reserve is going to reverse QE. Market participants are rightfully nervous. Helping to allay some of their worries – the scale and pace of reversal will be smaller and slower than the initial stimulus. At one point, the Fed was printing $70 billion every month during QE3. But when they start reversing next month, they will only sell back $10 billion of bonds to the market. From there, however, the plan is to gradually increase the monthly reversal amount up to a cap of $50 billion per month, $30 billion of Treasuries and $20 billion of mortgage backed securities. By the middle of 2018, we will be feeling the effects fully.
It is nice to have a graph of what $70 billion of monthly stimulus can do for the stock market. We do not, yet, have a graph of what $50 billion of monthly ‘coolant’ can do for stocks. It is likely that this will have a bigger immediate effect on mortgage rates – the Federal Reserve owns almost 30% of all mortgage-backed bonds. The effect on Treasuries could be more complicated – the Fed only owns 17% of all Treasuries. If mortgage rates rise too quickly, this could trigger recessionary forces, which in turn could lead to money flowing out of equities and into U.S. Treasuries.
We believe a diversified portfolio, with an eye toward risk management, is just as important as ever.
Data Sources:
www.standardandpoors.com – S&P 500 information
www.msci.com – MSCI EAFE information
www.barcap.com – Barclays Aggregate Bond information
www.bloomberg.com – U.S. Dollar & commodities performance
www.realtor.org – Housing market data
www.bea.gov – GDP numbers
www.bls.gov – CPI and unemployment numbers
www.commerce.gov – Consumer spending data
www.napm.org – PMI numbers
www.bigcharts.com – NYMEX crude prices, gold and other commodities
https://www.wsj.com/articles/the-fed-a-decade-after-the-crisis-is-about-to-embark-on-the-great-unwinding-1505746843 – Fed ownership percentages of MBS and Treasury markets
Any opinions expressed herein are solely those of the author, and do not in any way represent the views or opinions of any other person or entity.

: Worrisome to Broader Market?")


