The major U.S. stock market indices have seen an uptick in volatility this week.
The recent market action is in line with our outlook that the S&P 500 (NYSEARCA:SPY) and other market indices are trading in a wide range. Below we take a closer look at the S&P 500, Russell 2000 (NYSEARCA:IWM) and other market indicators and trends.
Key Takeaways: Recent stock rally failed to produce a breadth breakout and is stalling as leaders (and expected leaders) have weakened. U.S. markets could find the emerging backdrop less supportive as global breadth trends deteriorate. Sentiment indicators continue to show optimism ramping when stocks rally and pessimism reemerging during periods of weakness.
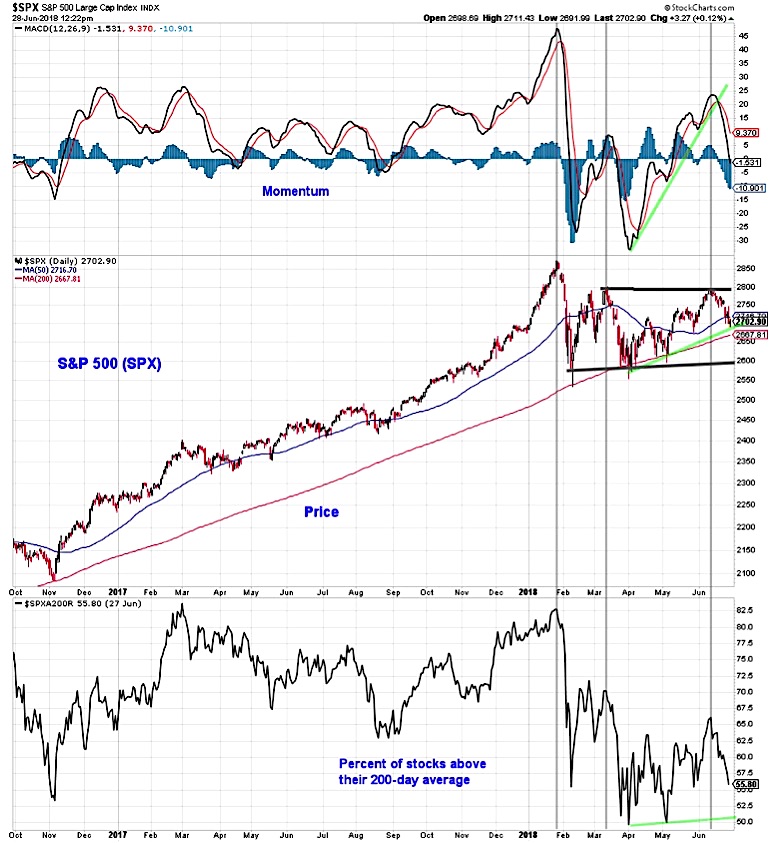
The S&P 500 remains in wide trading range as it has pulled back after failing to break through resistance near 2800. The up-trend in momentum that emerged as the index rallied off of its April low has been broken, suggesting that if support in the area between the 50-day average (2715) and the 200-day average (2668) fails to hold, the index could be facing a full re-test of the early-year lows (near 2600).
While momentum improved and price tested the March peak, breadth indicators failed to meaningfully move higher. Notably, the percentage of stocks in the index trading above their 200-day averages failed to match its March high (which was well-below the January peak) during the recent rally and has quickly deteriorated as the index-level rally has stalled. A move below the April and May lows by this indicator would suggest that the index itself has not completed its bottoming process.
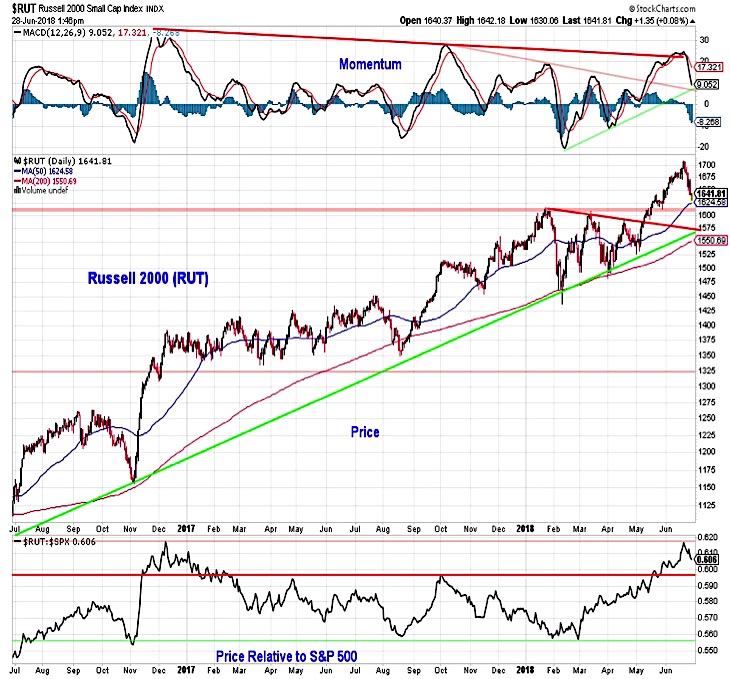
The small-cap Russell 2000 has been an area of notable strength within the U.S. equity markets in 2018. The Russell 2000 in May soared past its January and March peaks, moving into record territory and seeing year-to-date gains move into double-digits. The shorter-term momentum backdrop improved, but going back to late 2016 momentum has made a series of lower highs (and lower lows). The Russell 2000 has pulled back from its peak and could test the May breakout level (near 1600). Additional support is between 1550 and 1575. On a relative price basis, the Russell 2000 has yet to surpass its peak versus the S&P 500 that was seen in late 2016. Heading into mid-term elections, seasonal headwinds are blowing strongly against small-caps, so evidence of further deterioration should be watched carefully.
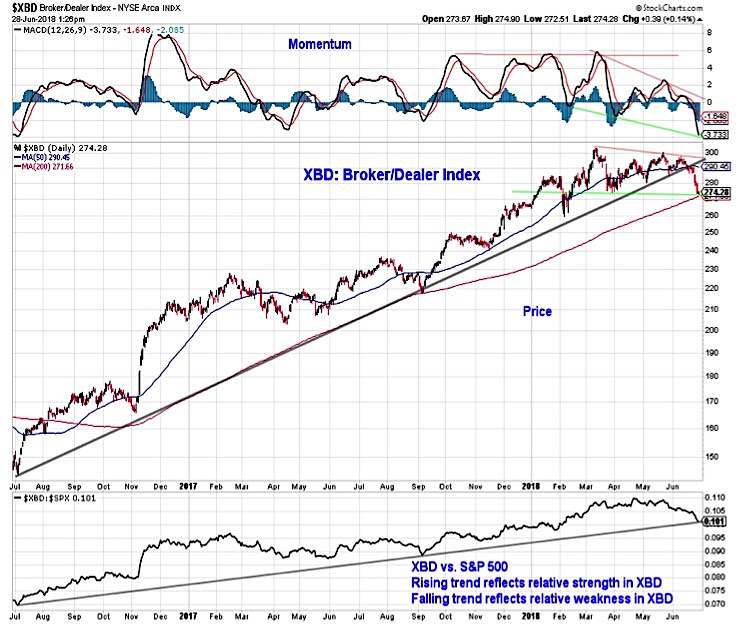
Stocks are not only contending with the potential deterioration from recent leaders (in addition to small-caps, the market-leading semiconductor index has stumbled of late), but also the lack of leadership from groups that typically act as leading indicators. The financial sector overall, and in particular the Broker/Dealer index, has come under pressure. From both a price and momentum perspective, XBD has deteriorated markedly in June. It has made lower lows after posting lower highs. From a relative price perspective, the up-trend versus the S&P 500 that goes back to mid-2016 is being challenged.
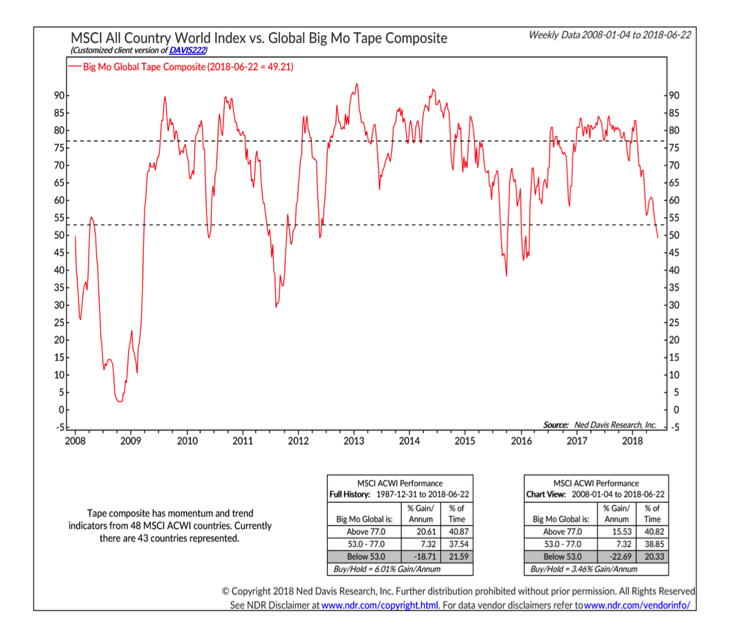
The domestic market rally has been characterized, from our perspective, as lacking sufficient broad market support to fuel an upside breakout (in addition the relative weakness in the percentage of stocks trading above their 200-day averages, the absence of a ‘breadth thrust’ has been notable). From a global perspective, breadth trends have been deteriorating to the point of warning of more significant weakness (not just an absence of strength). The NDR Global Big Mo Tape Composite (a composite look at global breadth trends) has deteriorated over the course of the first half of 2018 and is at its lowest level since the 2015-2016 cyclical downturn.
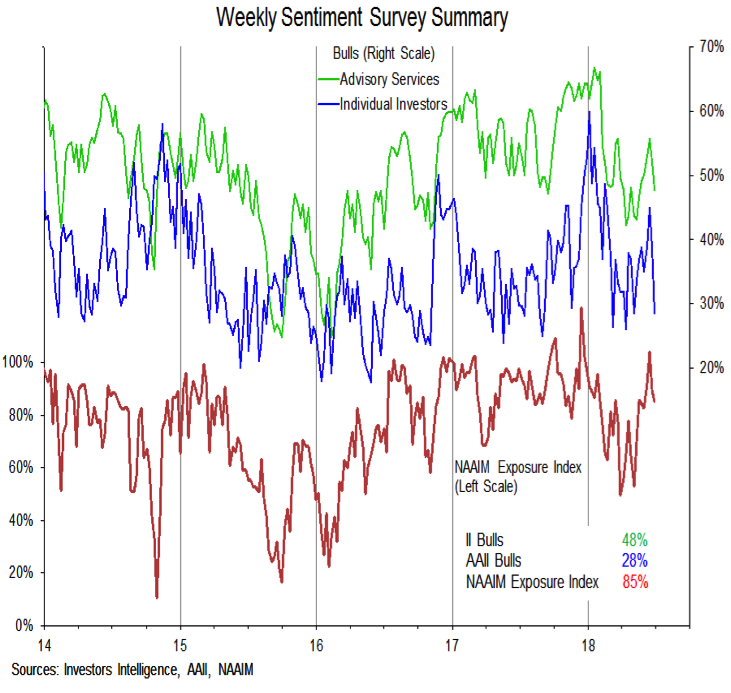
The weekly sentiment surveys continue to show a fairly consistent pattern. Periods of stock market strength are being met with optimism and times of selling are accompanied by a quick return of pessimism. For example, over the past two weeks, as stocks pulled back from their recent highs, Bulls on the AAII survey of individual investors dropped from 45% to 28% and Bears on the survey have surged from 22% to 41%. The Investors Intelligence data (which still shows only 18% Bears) and the NAAIM data (which has the exposure index at 85% and median equity exposure at an elevated 95%) have been slower to react. Stock market strength that is met with skepticism or selling that is met with complacency may be an important signal of a changing environment. Thus far, that has not been seen.
Twitter: @WillieDelwiche
Any opinions expressed herein are solely those of the author, and do not in any way represent the views or opinions of any other person or entity.


