S&P 500 Trading Outlook (2-3 Days): Expecting trend reversal between Friday and Tuesday
The S&P 500 has moved above stops from shorts at 2725, but a zone for trend change remains in effect through early next week.
That said, we’ll need to await the S&P 500 turning back down and under 2725 again before taking action. Near-term resistance lies at 2744-6, and 2750-1. Volatility may tick higher again soon.
TECHNICAL THOUGHTS
The S&P 500 failed to stall out on Thursday, rallying above the 50% Fibonacci retracement. It’s now closing in on the 61.8% Fib. Meanwhile, Transports along with most of Europe continue to show real underperformance on this bounce. As well, the Russell 2k has not yet recaptured the area of trendline support that was broken (now resistance) and this could also be a factor heading into next week.
While many are quick to jump onboard this rally in thinking new highs are around the corner, the decline managed to cause some pretty major damage to momentum while also causing many stock market indices to rollover to Negative on a weekly basis (when looking at MACD). In many cases, a couple day bounce has not helped these to be “free and clear” to move back to new highs.
Three things to consider between now and early next week that could be important: Transports, Russell 2000 and Investor Sentiment.
The first two were instrumental in turning down sharply in mid-January which provided some key technical clues about the impending decline and now both have been very slow to turn back up in a way where sufficient strength has been reclaimed to suggest the decline has run its course. Europe also has been a huge laggard in recent days and has barely made any progress off these lows. Sentiment meanwhile has improved sharply in recent days, and Equity Put/call data have reflected this, pulling back from over .90 to .60 in a short period of time, which seems odd given the small rally compared to the degree that declines occurred on overwhelmingly poor breadth of greater than 10/1. Now the bounce is happening on 2/1 breadth, but many are embracing, thinking this was just a minor pullback yet again and no damage has been done. Overall the next 2-3 trading days will be instrumental as to whether this can stall out and turn down but it’s important to relay that Thursday’s action doesn’t mean new highs are imminent.
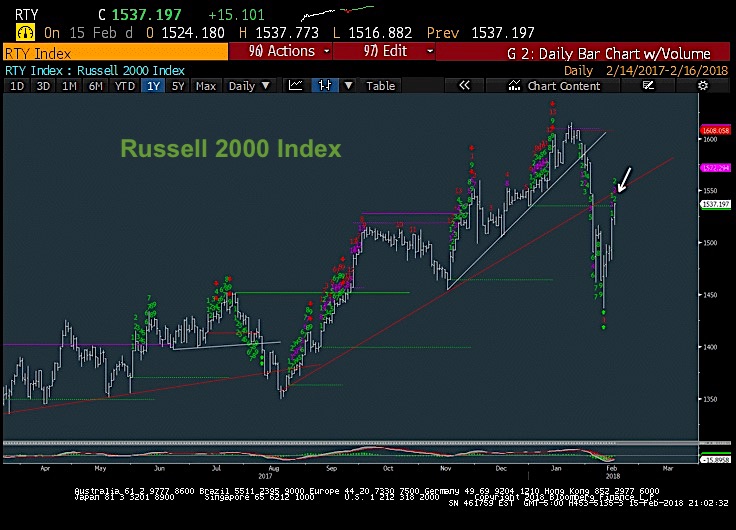
CHART SPOTLIGHT: RUSSELL 2000
Russell 2000 weakness was key in thinking the market was peaking in mid-to-late January and has not regained the area where it broke down. While the strength of Thursday’s rally made many believe the market was yet again “Off to the races” its important to watch the leading sectors carefully which gave strong clues about breaking down and as of now, have NOT gotten back above areas which would think it’s “Free and Clear” for rallies to continue. So the next 2-3 trading days will tell us much about the durability of this rally.
If you have an interest in seeing timely intra-day market updates on my private twitter feed, please follow @NewtonAdvisors. Also, feel free to send me an email at info@newtonadvisor.com regarding how my Technical work can add alpha to your portfolio management process.
Twitter: @MarkNewtonCMT
Author has positions in mentioned securities at the time of publication. Any opinions expressed herein are solely those of the author, and do not in any way represent the views or opinions of any other person or entity.


")

