The stock market action of the past few days is noteworthy and exhaustive (despite the rise).
The market is weakening from early highs, and as of now, five sectors are down on the day, with the S&P 500 (INDEXSP:.INX) marginally positive and the Nasdaq towing the line. In the last few days this has been commonplace, with merely Technology serving as the driving force to carry markets to new highs.
The percentage of stocks above their 10-day moving average remains stubbornly low and under 50% as of last night’s 48% reading.
As well, Industrials remain lower and have dropped 2% in the last 8 trading days, while the Tech sector is finally showing some weakness today. Utilities, Real estate and Telecomm are all lower.
The NASDAQ Composite (INDEXNASDAQ:.IXIC) as of now, is hugging the Flat line and has also reversed early gains.
Interestingly enough, just a time when Economic data and earnings seem to be in sync and both turning strong, Bond yields have gone the other direction with long-term yields starting to turn down. This is having the effect of causing the Yield curve to flatten out pretty dramatically again with 2s/10s almost back to new lows , undercutting the lows of the past few months. HOWEVER, a move on the 10-year US Treasury Yield (INDEXCBOE:TNX) below 2.355% will effectively break the uptrend which has been intact over the last month and looks to be important (as this could also affect Financials).
Overall, trends will be positive in S&P 500 until we see movement back down under 2560, but market breadth is clearly not confirming the move higher of late, and if Tech and Financials begin to reverse course, the latter based on Yields turning down and yield curves flattening, this could be a real Headwind for Stocks.
Below are a few charts to put this into perspective:
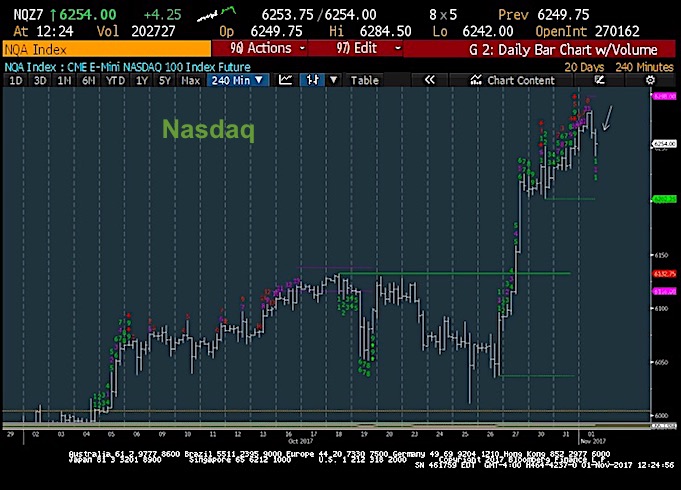
NASDAQ Composite
A 30 point NASDAQ reversal looks like a blip on the charts. But prices have gotten very overdone on the daily and intra-day timeframe. This 240 min chart shows the confirmation of TD COMBO sells.
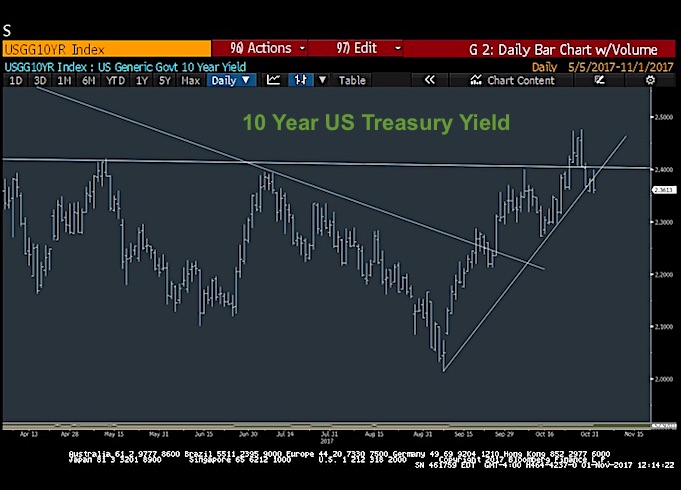
10-Year Treasury Bond Yield (TNX)
10-Year Yields reversed course nearly a week ago and are traded briefly under yesterday’s yield lows. A move below 2.35 would be negative short-term and likely affect the Financials.
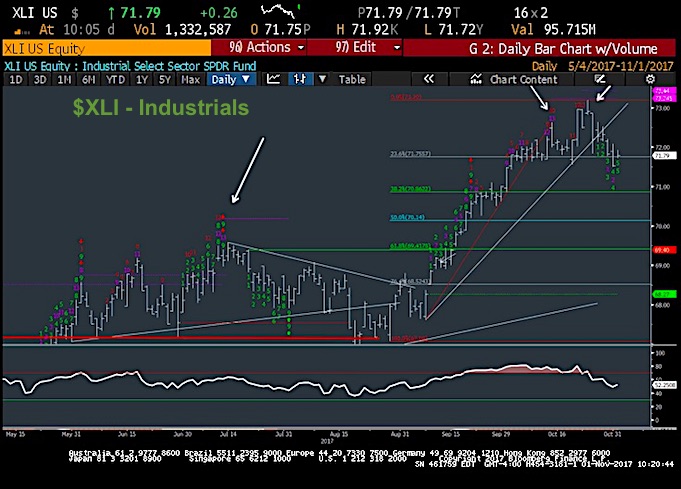
S&P Industrials (XLI)
Despite all the talk of new highs, the S&P Industrials ETF (NYSEARCA:XLI) remains 2% lower than it was back on October 20. There are increasing signs of weakness creeping in to the Transports and Industrials.
Thanks for reading.
Twitter: @MarkNewtonCMT
Author has positions in mentioned securities at the time of publication. Any opinions expressed herein are solely those of the author, and do not in any way represent the views or opinions of any other person or entity.
 Rolling Over At Key Fibonacci Level?")


 Rolling Over At Key Fibonacci Level?")

