We’re seeing some minor backing and filling today following Tuesdays’s big rally. The S&P 500 Index (INDEXSP:.INX) is giving back around 1/3 of yesterday’s gains at the time of this writing. European stocks are also trading fractionally lower despite some good economic data.
The trend remains lower from early August but the bump in the last few days should have further to run before turning lower. Therefore, today’s weakness should be buyable for “traders” unless (until) pullbacks dip back under 2430.
For today, 2438 – 2441 on S&P 500 futures is a strong price support zone. The bounce could last into month-end. Key developments for yesterday’s price action revolved largely around Healthcare, with the Biotech Sector (NASDAQ:IBB) breaking out alongside some solid action in Technology.
The Euro (CURRENCY:EUR) still looks like it wants to go higher… the U.S. Dollar (CURRENCY:USD) is attempting to bounce but remains below recent highs. Treasury yields are also giving back gains from yesterday. Taken all together, this supports the Precious Metals trade in the short run.
Stay nimble but expect higher prices into next week if 2430 holds.
Here are 3 charts I’m watching…
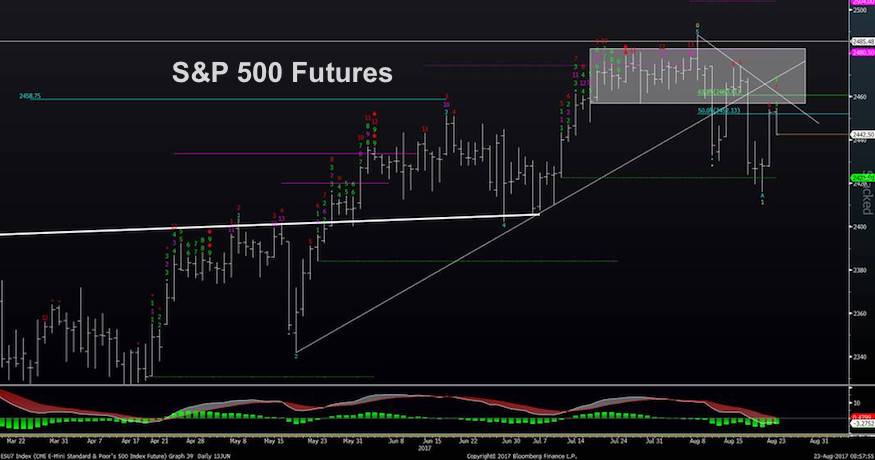
S&P 500 Futures (Daily) – Yesterday’s rally still hasn’t exceeded downtrend from August and trend from early month remains down and momentum bearish. However, a high volume bounce yesterday still can lead prices higher into end of month.. and key will be 2462 in futures on the upside. Pullbacks should hold at 2430-39 in Sept futures- UNDER 2430 would be a bit more negative, supporting the idea of a retest of early week lows at 2415.75
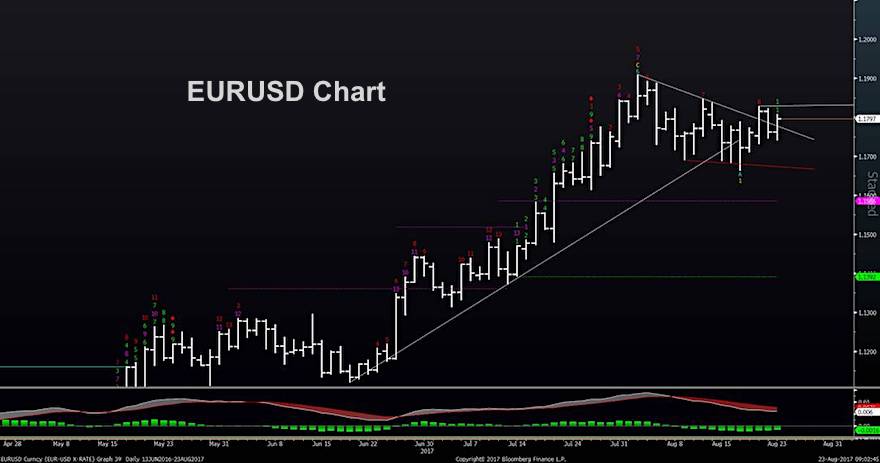
EURUSD (Euro vs USD) – Strong European economic data has caused prices to retrace prior days losses and likely to get up above prior days highs at 1.1828 and up to 1.1910 and over in the short run. So despite Pound sterling having sold off throughout the month of August vs USD. The EURO and YEN have been more choppy/range-bound but with a bias for Euro to still rise up to 1.19 or slightly above
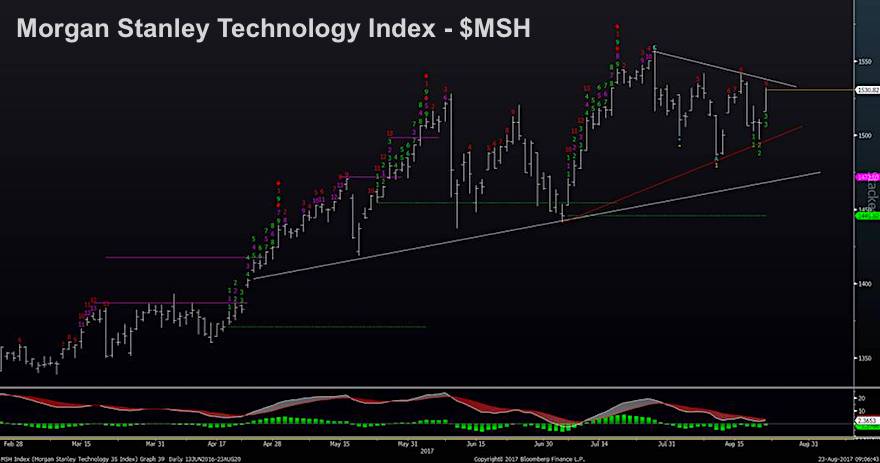
MSH Morgan Stanley Technology Index – Looks quite constructive structurally, and not as bearish as some of the other sectors. Note the overlapping pattern of late with sharp rallies back after pullback attempts and the recent higher low. A move up over 1541 in the Equal-weighted MSH index for TECH would support the idea of a move back to new highs at least in the short run.
Thanks for reading and good luck out there.
If you are an institutional investor and have an interest in seeing timely intra-day market updates on my private twitter feed, please follow @NewtonAdvisors. Also, feel free to send me an email at info@newtonadvisor.com regarding how my Technical work can add alpha to your portfolio management process.
Twitter: @MarkNewtonCMT
Author has positions in mentioned securities at the time of publication. Any opinions expressed herein are solely those of the author, and do not in any way represent the views or opinions of any other person or entity.


