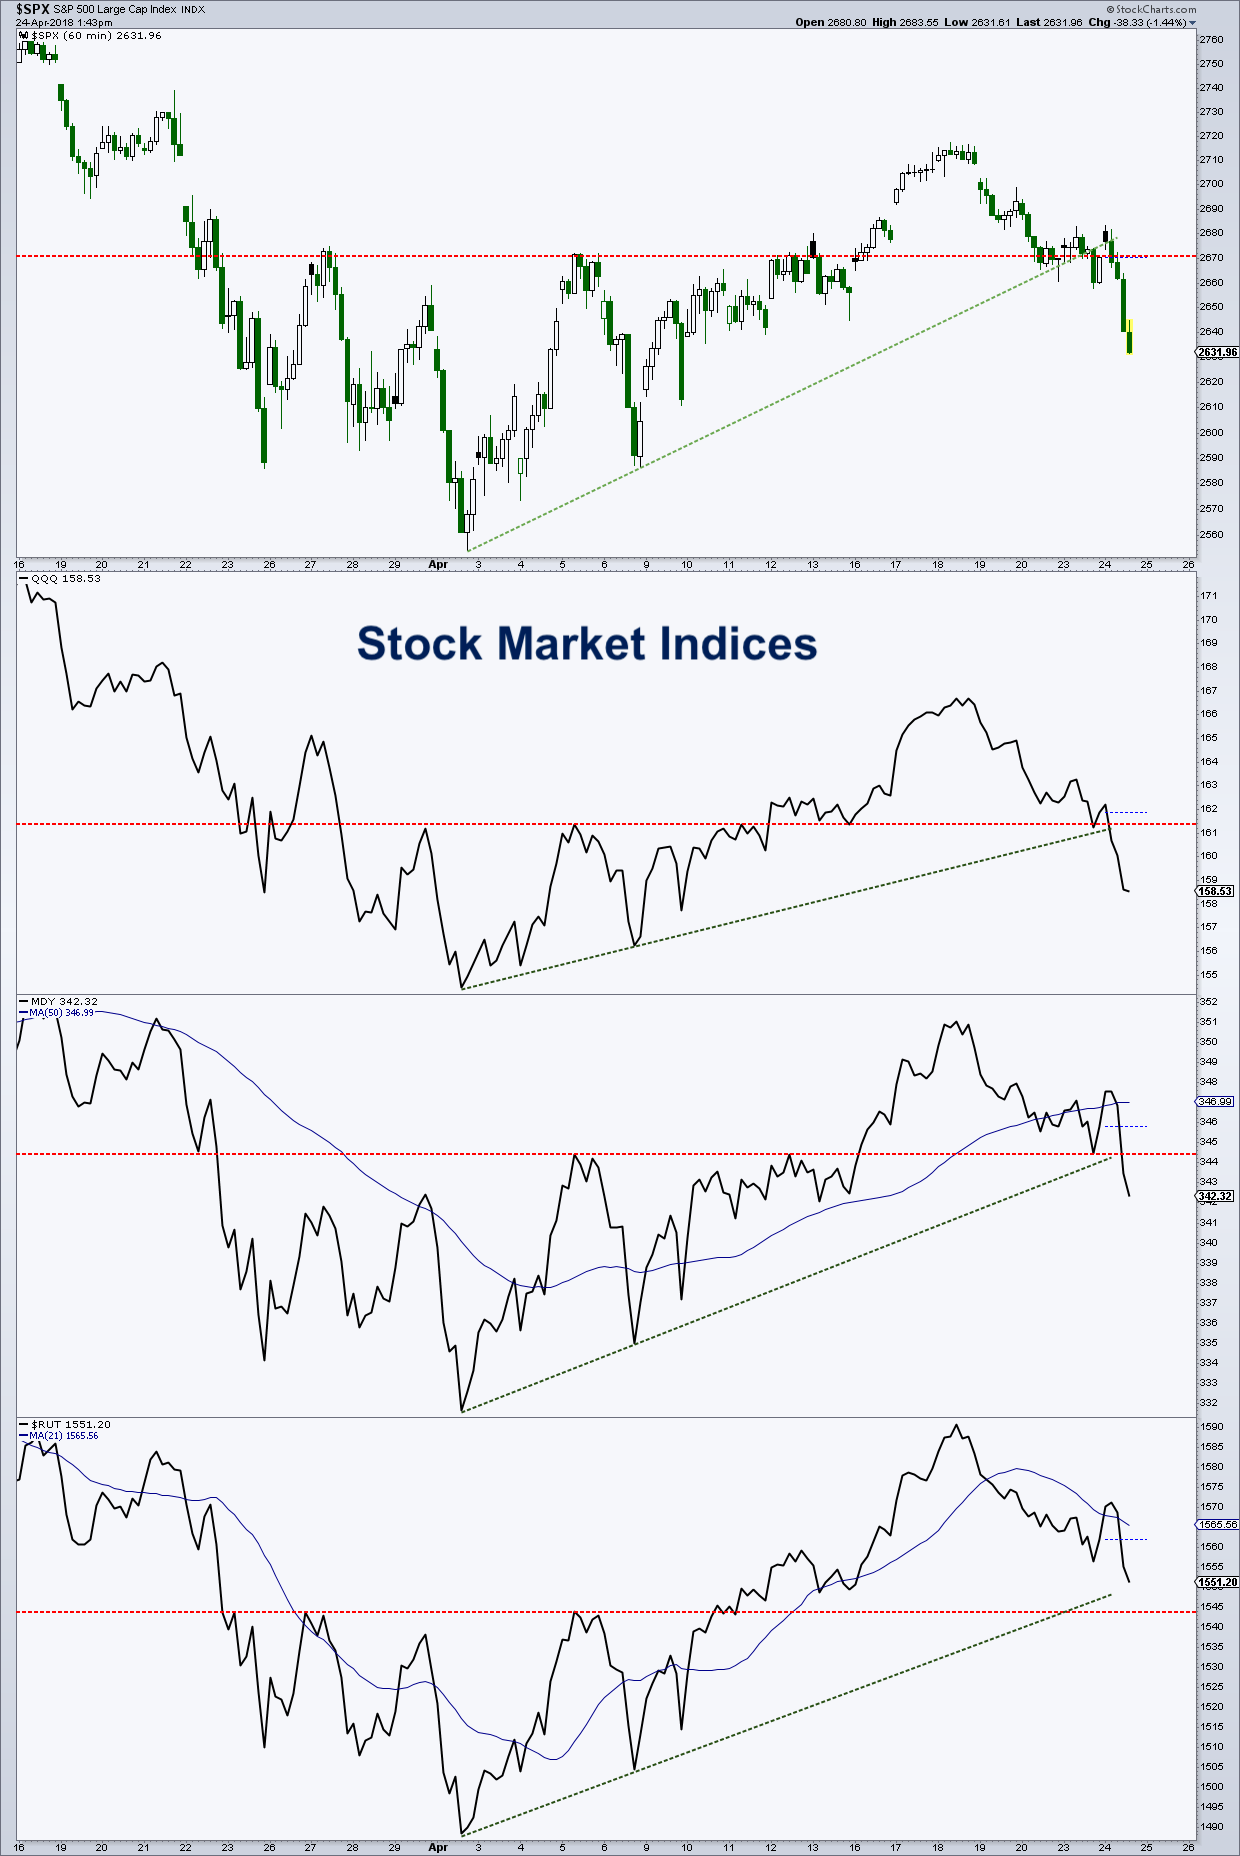
Been a rough week for the S&P 500 and like broad market indices.
And Tuesday’s price action offered an exclamation point delivered on behalf of the bears.
The complex inverse head-and-shoulders (H&S) all failed except the Russell 2000.
In the latest “On The Mark” newsletter, I said be careful if the 2,670 does not hold on the S&P 500.
Here’s a look at the S&P 500 and other broad indices:
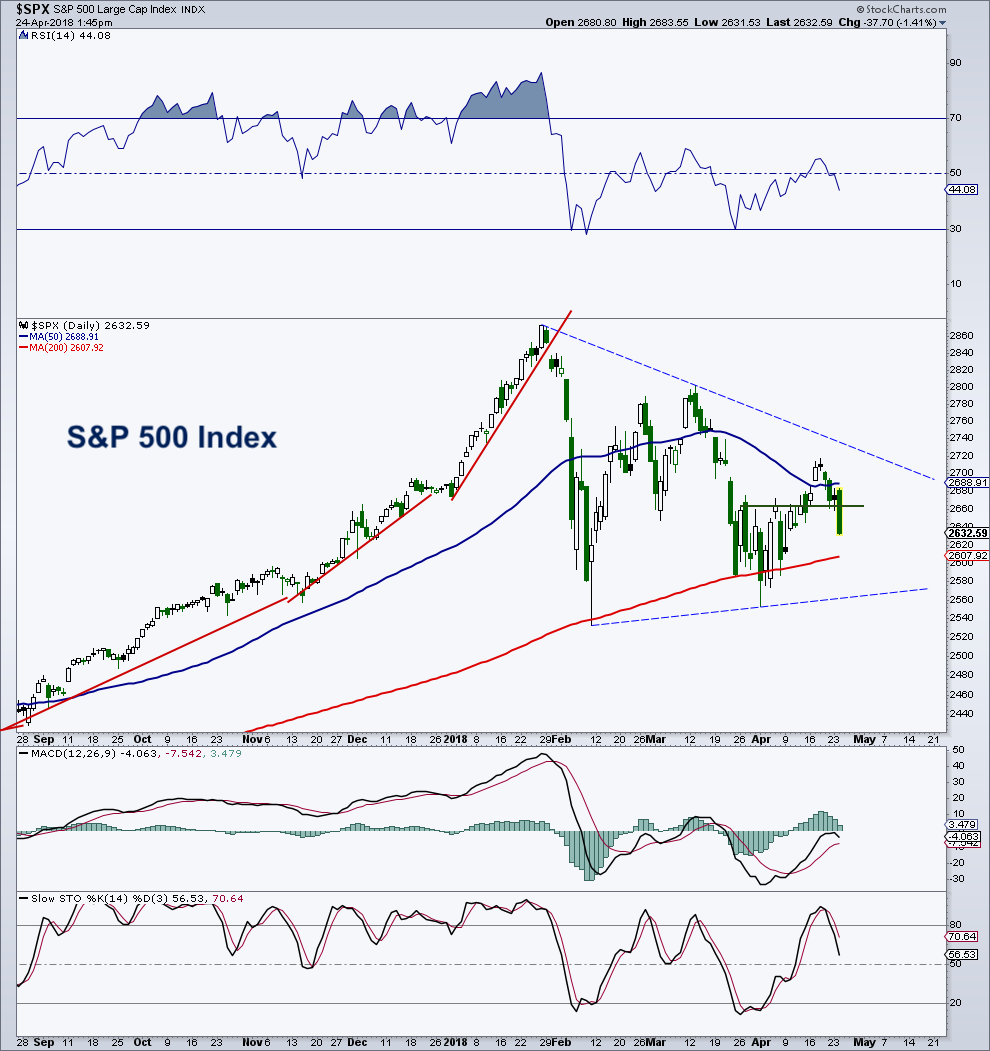
S&P 500 Daily Chart
On the daily chart of the S&P 500, the 200-day moving average at 2,608 is certainly in focus as well as the February and April lows between 2,533 and 2,554. Triangles and wave 4’s (if this is correct) tend to be very tough investment environments.
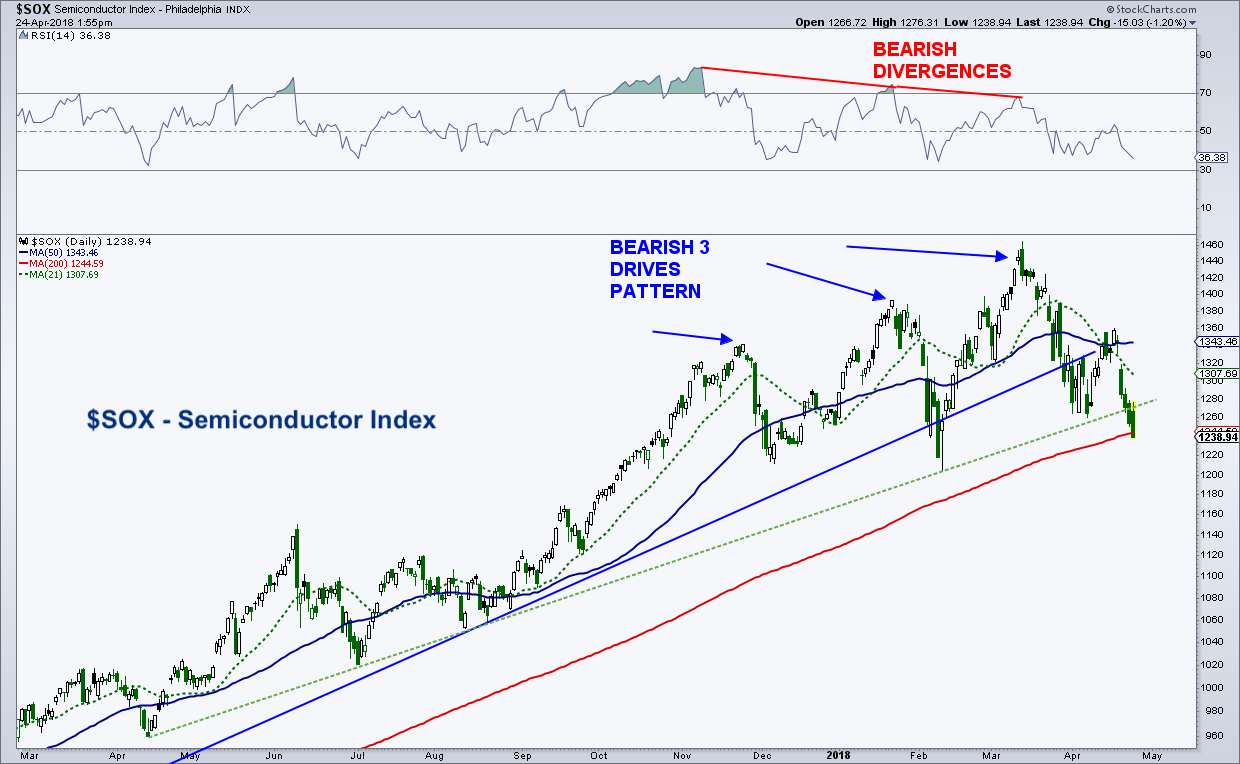
Semiconductor Index
And, as I’ve talked about a couple times, the SOX is now testing its 200-day after tracing out a bearish 3 drives pattern. This was a leadership group and it is bearish when the leaders start leading on the downside.
Feel free to reach out to me at arbetermark@gmail.com for inquiries about my newsletter “On The Mark”. Thanks for reading.
Twitter: @MarkArbeter
The author may have a position in mentioned securities at the time of publication. Any opinions expressed herein are solely those of the author, and do not in any way represent the views or opinions of any other person or entity.


 Flirting With Critical Support… Again")


