Concerns abound as stocks toil and interest rates continue to rise.
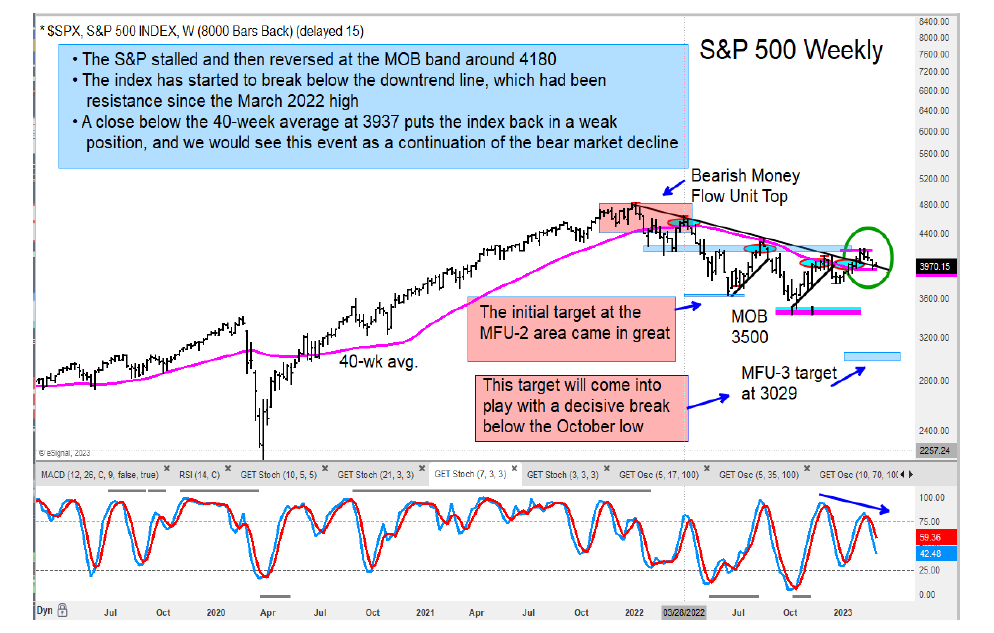
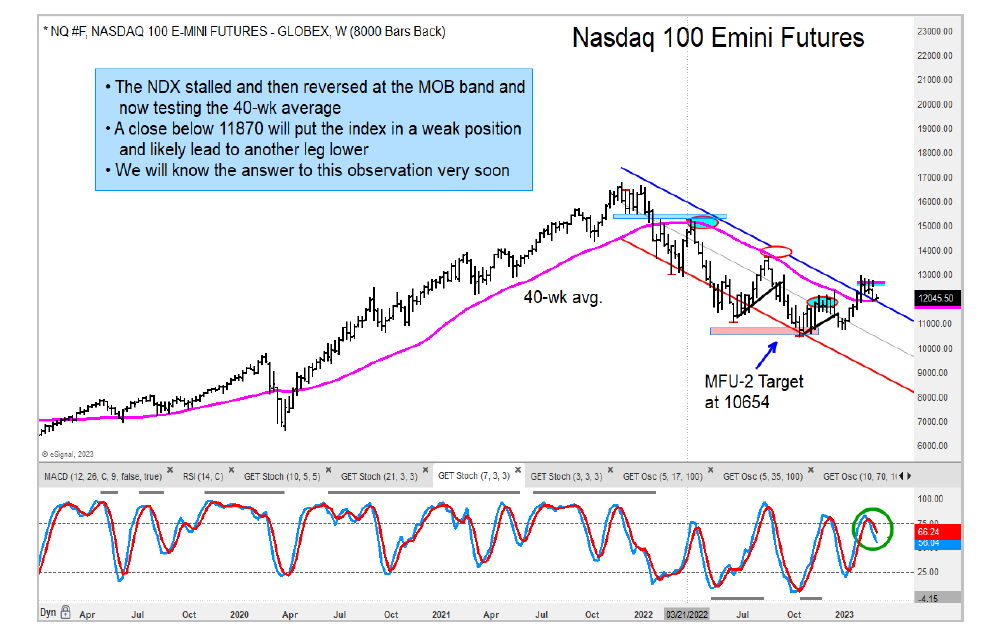
Today, we are highlighting the S&P 500 and Nasdaq 100 as two important indices that have reversed from MOB target and price resistance zones and have weakening momentum. See charts below.
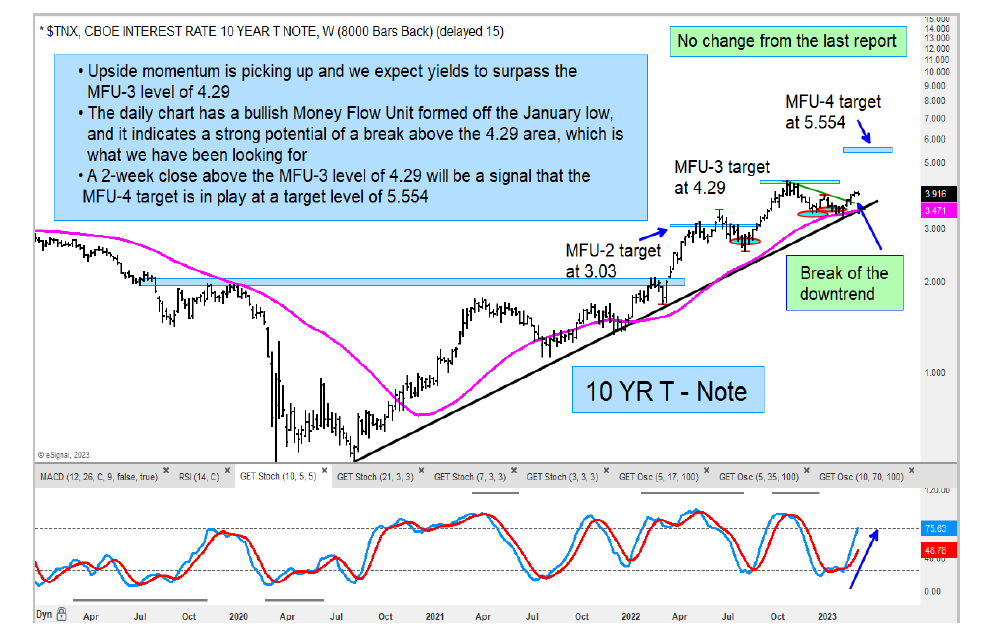
As well, both the U.S. Dollar and the T-Bond 10 Year treasury bond yield continues to look higher. See chart of treasury bond yield below.
In other areas, the Metals and Mining ETF (XME) triggered a buy signal. On the flip side, we are seeing weakness in the software and healthcare sectors. Volatile and uneven market. Continue to watch for relative strength/weakness.
S&P 500, Nasdaq 100 futures, and 10-Year Treasury Bond Yield Charts
Twitter: @GuyCerundolo
The author or his firm have a position in mentioned securities at the time of publication. Any opinions expressed herein are solely those of the author, and do not in any way represent the views or opinions of any other person or entity.
: Creating Bullish Divergence?")


 and Semiconductors (SMH): Concerning Price Pattern?")


