Stocks and the economy in the U.S. sit at a veritable crossroads.
In approaching resistance near 2800 (the level at which the October and November rally attempts stalled), the S&P 500 last week completed a full retracement of the December decline.
From a breadth perspective, the percentage of stocks in the S&P 500 trading above their 200-day moving average (currently 64%) has already eclipsed its highs from the October/November time frame (52%), yet the down-trend off of the January peak remains intact.
While there have been pockets of encouragement, trends from abroad have lagged the improvement seen at home.
Less than 20% of global markets are in uptrends, as defined by the direction of their 200-day averages. Near-term momentum has surged and the rally off of the December lows has been accompanied by an accumulation of positive breadth thrusts, yet longer-term momentum trends remain a challenge.
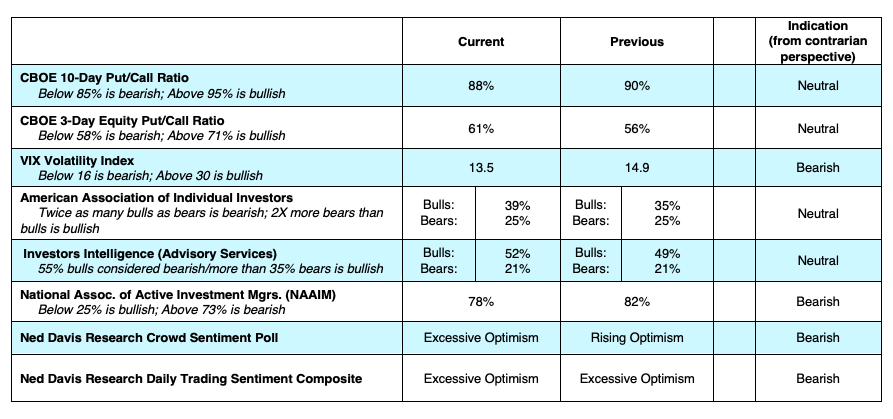
Sentiment indicators showed a continued reemergence of complacency and optimism. The 10-day CBOE put/call ratio has dropped to its lowest level since September, and the NDR Crowd Sentiment Poll this week has moved back into the excessive optimism zone for the first time since early October. A notable exception from a sentiment perspective has been fund flow data. Equity fund outflows have slowed since late December but inflows have yet to be seen on a widespread and sustained basis.
Economic data continues to generally surprise to the downside. As an example, this past Thursday had six data points that were worse than expected, while only two were better than expected.
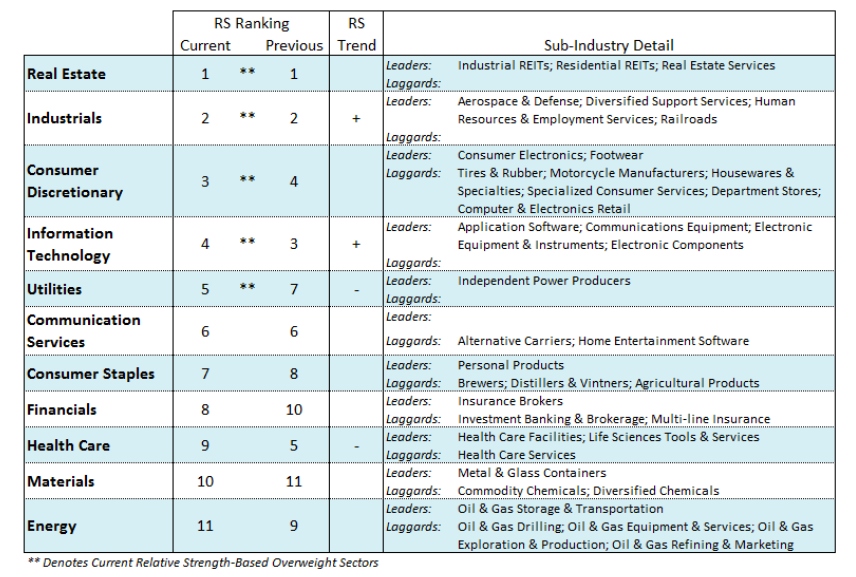
On top of this, according to FactSet, the earnings beat rate for the fourth quarter (69%) is below both the one-year and five-year averages (77% and 71%, respectively). The path of earnings expectations for 2019 continues to move lower. In contrast to this, copper prices (typically viewed as sensitive to global economic conditions) have rallied 15% from their early year low and are testing resistance, while sector-level leadership is moving toward economically sensitive areas like Industrials and Consumer Discretionary.
Overall, while the economic and earnings bar may need to be lowered further, there is reason to believe that the U.S. economy may still be on firmer footing than some now fear.
The overall weight of the evidence remains neutral.
Twitter: @WillieDelwiche
Any opinions expressed herein are solely those of the author, and do not in any way represent the views or opinions of any other person or entity.


