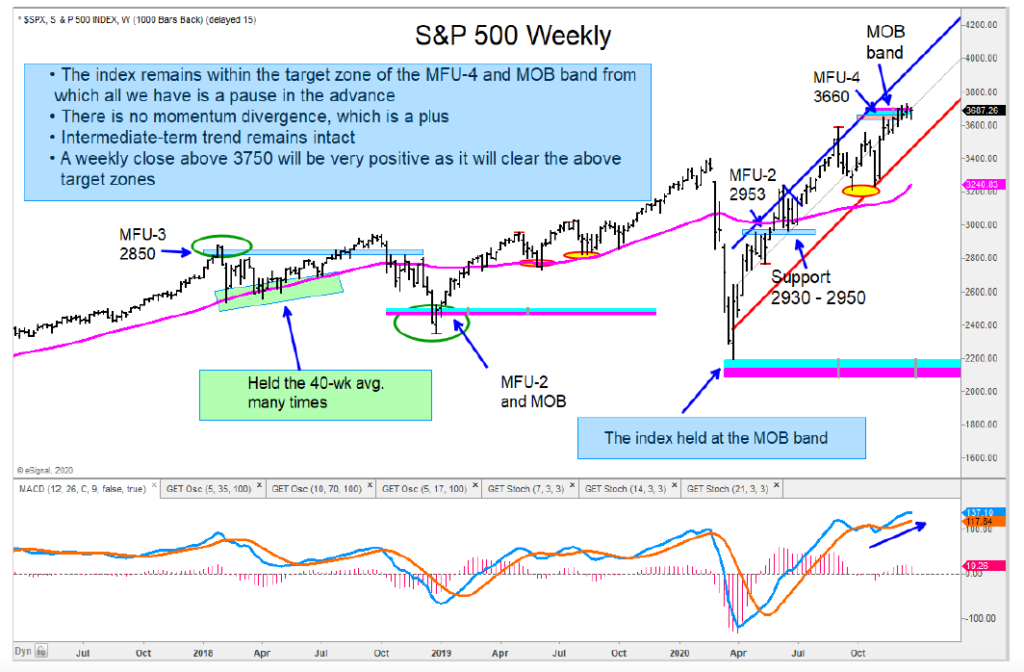
It has been a little over one month now where we have the S&P 500 stuck within the target zone of our Money Flow Unit and MOB band. This continues to be a pause area, and the index would need a weekly close above 3750 to signal a bullish breakout above this range.
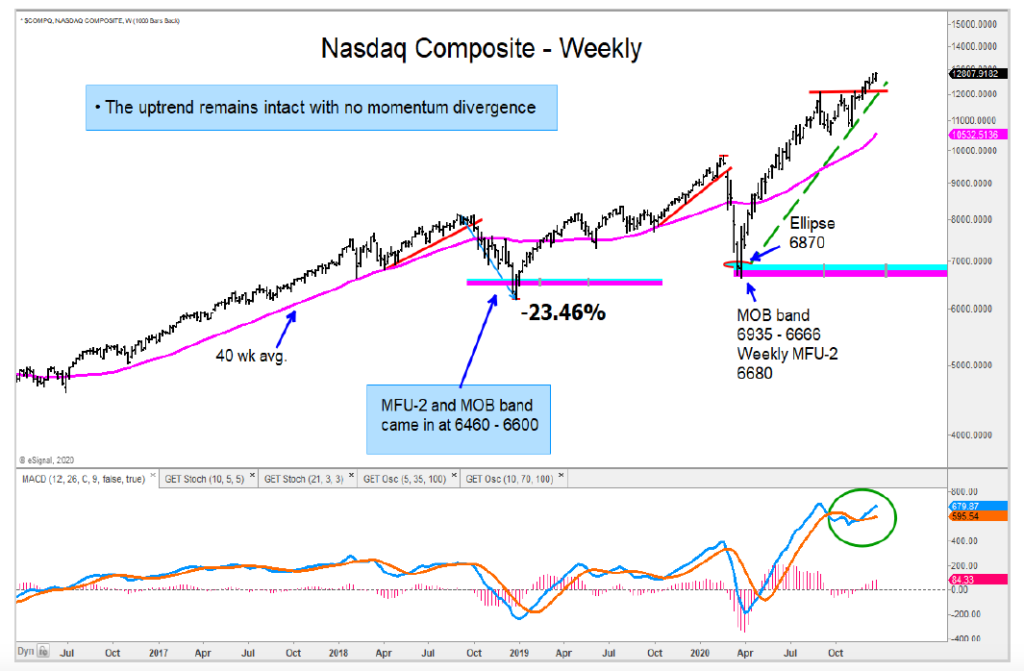
The Uptrend in the Nasdaq Composite remains intact, but I do have the daily chart indicating a potential stall zone directly ahead. No divergence, therefore no sell signal.
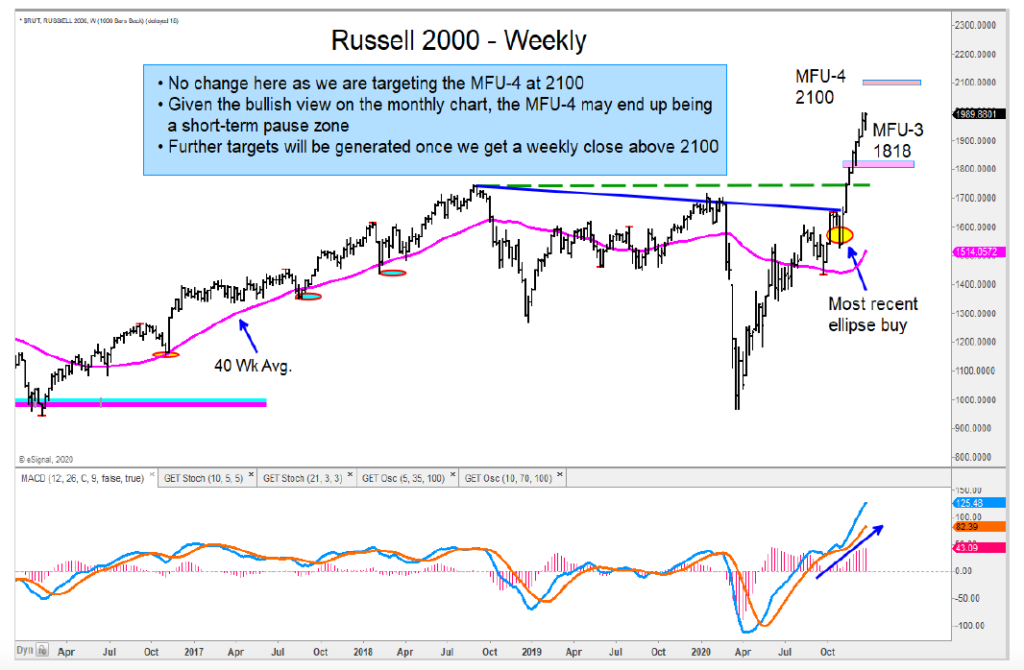
As mentioned in previous reports, the Russell 2000 and MidCap (MDY) are my two favored segments of the equity market. The longer-term monthly charts of both indices are clearly VERY bullish, and I see more upside in both.
The Dow Transports remain in a stable uptrend, and I am looking to buy a pullback.
I remain bullish the Biotech industry group, and we have the IBB biotech etf getting close to one of our intermediate-term targets.
When looking at the Momentum Factor ETF (MTUM) relative to the S&P 500 Low Volatility ETF (SPLV) continues to favor MTUM. I see more upside from here.
The author may have a position in mentioned securities at the time of publication. Any opinions expressed herein are solely those of the author, and do not in any way represent the views or opinions of any other person or entity.
: Creating Bullish Divergence?")


: Creating Bullish Divergence?")