July was an uneventful month, as equity and credit markets continued to drift higher after the June shock of ‘Brexit’ wore off. U.S. payrolls data shows a continued, if uneven, recovery in the U.S. As well, there was an absence of any additional financial shocks from around the world.
Stocks & Bonds
Global stock markets surprised many market pundits by shrugging off Brexit and roaring back in July. The S&P 500 Index (INDEXSP:.INX) rose nearly 4 percent. European equities outperformed, after underperforming in June. There has been little volatility in currency markets.
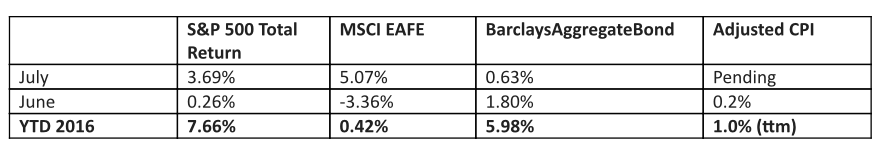
A financial market review, by the numbers:
Commodities & Currencies
Oil prices dropped significantly in July, ending at just over $40/barrel. The drop for the month was just over 15%, and year-to-date prices are off just about 2%. Historic global inventories, both on land and on sea, mean that any increase in demand is easily met with excess supply from storage. Most commodities continue to face headwinds as Chinese manufacturing contracts. Gold is an exception, as demand for the ‘safe haven’ commodity was stoked by Brexit. Gold prices went to $1,357.50/oz in July, and are up almost 28% year-to-date.
The dollar traded sideways in July, ending the month almost exactly where it began. For the year, the greenback has lost just over 3% of its value against a trade-weighted basket of currencies.
Economy
ISM Manufacturing PMI in July came in at 52.6, a fifth month of expansion albeit at a slower pace than In June. The non-manufacturing, or services, index showed a reading of 55.5 in July, down from 56.5 in June but still showing solid expansion. The Commerce Department released its initial estimate of second quarter GDP growth, which surprised many by coming in at a lackluster 1.2%. The National Association of Realtors reports that existing-home sales in June 2016 were 3% higher than in June 2015, and the median sale price increased 4.8% from $236,300 to $247,700. Distressed sales (foreclosures and short-sales) were 6% of the market in June.
Commentary
Conventional wisdom is that an investor cannot successfully time the stock market. But what does this phrase mean exactly? After all, anyone who buys a stock is timing the market – they are presuming that at some point in the future, a year or 10 years or more, they will be able to sell that stock for a profit, or that the stock will generate profitable dividends over that time period. So in a sense, everyone is ‘timing’ the stock market.
The phrase ‘you can’t time the stock market’ is really just shorthand for ‘be patient’ and ‘be consistent.’ This chart shows the effects if someone had been trying to time the market, and instead just missed out on the 25 best days since 1970. That is a very small number of days to miss, since there were over 11,000 trading days since then. (chart source: Michael Batnick – @MichaelBatnick)
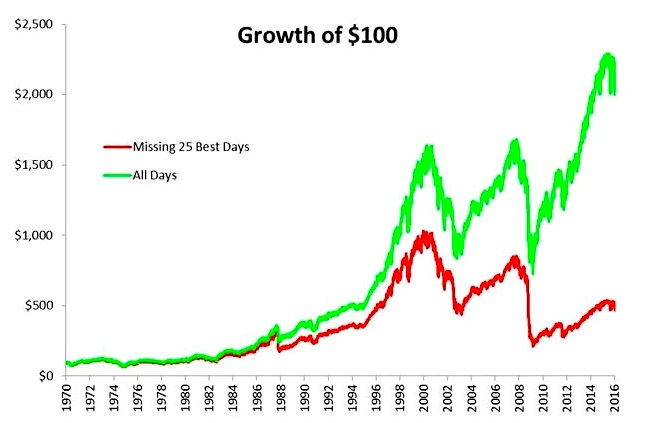
This chart shows missing even a few great days can significantly hurt your returns over time. As we enter the autumn months, a historically challenging period for stocks, I would encourage my clients to continue to ‘time’ the market with a long-term horizon, rather than short-term. The market may soften over the coming months, something that a patient investor can endure or even capitalize upon. Or perhaps, the 26th best day might happen in the next few months, beating all odds.
The stock market is amazing in its ability to confound expectations – look at the 3.69% return for the S&P 500 in July, right after Brexit, which threatened the very existence of the eurozone and by definition the global financial system. The market chose to say ‘that should be fine,’ shrugged off the news, and kept moving ahead. Tomorrow is unknown, and the day after tomorrow is unknowable, but population and technology growth over the next 10 years are likely to create greater aggregate wealth, and that bodes well for the discerning and patient investor.
Thanks for reading.
This material was prepared by Greg Naylor, and all views within are expressly his. This information should not be construed as investment, tax or legal advice and may not be relied upon for the purpose of avoiding any Federal tax liability. This is not a solicitation or recommendation to purchase or sell any investment or insurance product or service, and should not be relied upon as such. The S&P500, MSCI EAFE and Barclays Aggregate Bond Index are indexes. It is not possible to invest directly in an index. The information is based on sources believed to be reliable, but its accuracy is not guaranteed.
Investing involves risks and investors may incur a profit or a loss. Past performance is not an indication of future results. There is no guarantee that a diversified portfolio will outperform a non-diversified portfolio in any given market environment. No investment strategy can guarantee a profit or protect against loss in periods of declining values. Listed entities are not affiliated.
Data Sources:
- www.standardandpoors.com – S&P 500 information
- www.msci.com – MSCI EAFE information
- www.barcap.com – Barclays Aggregate Bond information
- www.bloomberg.com – U.S. Dollar & commodities performance
- www.realtor.org – Housing market data
- www.bea.gov – GDP numbers
- www.bls.gov – CPI and unemployment numbers
- www.commerce.gov – Consumer spending data
- www.napm.org – PMI numbers
- www.bigcharts.com – NYMEX crude prices, gold and other commodities
- www.federalreserve.org – historical data on 10-year Treasury note
Any opinions expressed herein are solely those of the author, and do not in any way represent the views or opinions of any other person or entity.


