There continues to be lots of talk surrounding the US Dollar following its incredible rally to 14 year highs off Trump’s election victory.
So, where does the greenback go from here? Does the US Dollar rally have more room to run?
These are questions a lot of traders and investors have on their mind as of late. Let’s take a look at the technical situation, bearing in mind that the Federal Reserve meeting is around the corner (an event that’s particularly important for short-term traders).
The US Dollar Index (CURRENCY:USD) is coming off a week of consolidation characterized by some wild intraday swings. Technically, the levels that needed to hold, did, leaving a bullish bias in place on longer term charts. That said, there is a distinct possibility of more consolidation near-term.
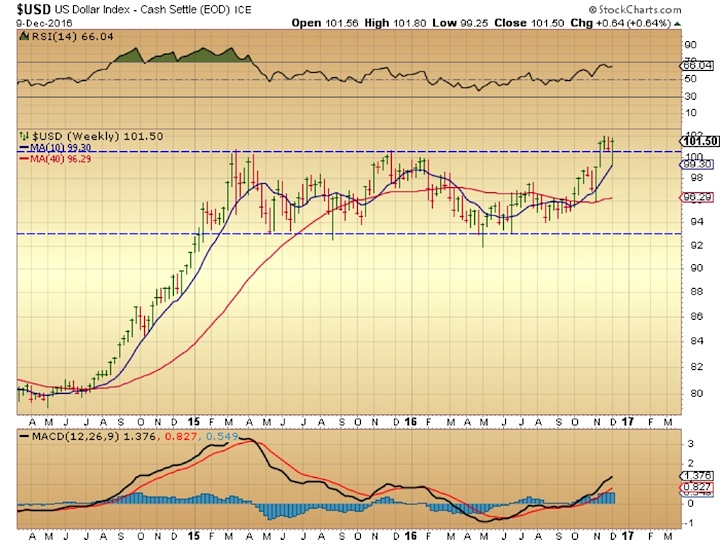
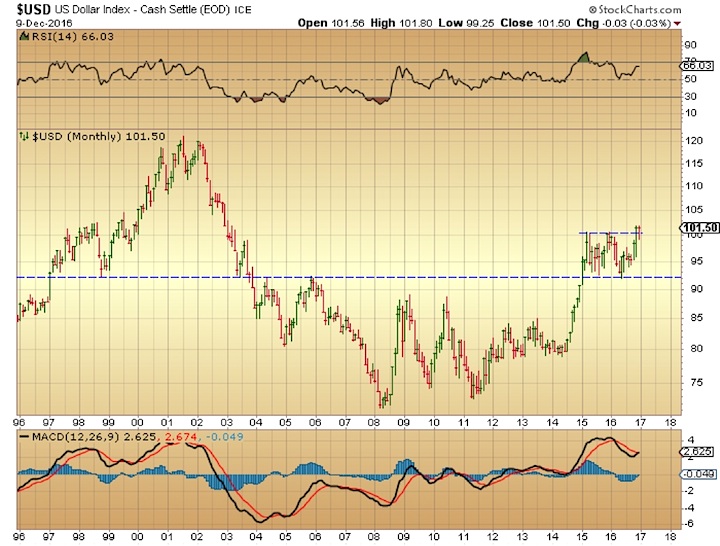
The weekly and monthly charts below show a bullish bias that was not invalidated following last week’s volatility. The weekly chart is particularly telling in my opinion, as the action supports a healthy consolidation phase preceding a possible continuation move higher.
On the weekly, the US Dollar Index broke above long term horizontal resistance last month then successfully back tested the break out trigger for two consecutive weeks before dipping slightly below it last week. It then bounced hard off the 10 week moving average to reclaim the $100.50 level before the end of the week. There is currently support below at $101.50, $100.50, $100, $99.30 and $98.45. Resistance stands at $102, $103.40 $104 and $105.
Short-term charts also show some consolidation albeit with more volatility, especially last week. Even on the daily, however, the technical damage was limited as price recovered on Thursday and Friday. As well, the index closed the week up 0.64%, near the top of the range.
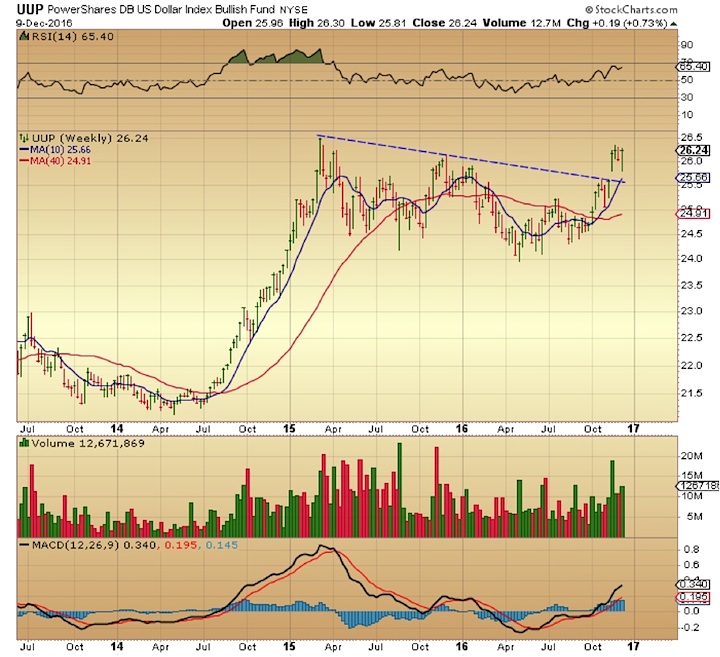
The weekly chart of the PowerShares Bullish DB US Dollar Index (NYSEARCA:UUP) below confirms a beautiful break out on the week of 11/14 and price action sustaining the break in the weeks that followed.
There are of course many variables that can influence currencies, as they are more exposed to macro factors and central bank policy than other securities. While true that the US Dollar is under constant headline risk, it is also true that trading it solely based on price can help filter out much of the noise and provide you with some sound sleep. I find this especially true after the rally we’ve seen in the greenback over the past several weeks.
Although nothing has changed on longer term charts, keep an open mind and stay flexible if trading this on shorter timeframes. There could still be some volatility and/or sideways action in store for the greenback in the near term. Trade it accordingly and as always, manage the trade based on your risk tolerance and timeframe.
Thanks for reading.
Twitter: @DDCapitalFund
The author does not have a position in mentioned securities at the time of publication. Any opinions expressed herein are solely those of the author, and do not in any way represent the views or opinions of any other person or entity.


 Flirting With Critical Support… Again")


