US Corn and Soybeans Market: Planted Acreage Considerations for 2016
With the 2015/16 U.S. corn and soybean production figures finalized in the January 2016 WASDE report, the corn market focus has now shifted quickly to some first impressions regarding 2016/17 corn production prospects. This past Tuesday Informa Economics released its revised 2016 planted acreage estimates for U.S. corn and soybeans. Corn planted acreage was projected at 88.869 million, which was down slightly from Informa’s estimate a month ago; however the projection for corn planted acreage still represented an increase of 870,000 acres versus 2015. Conversely Informa raised its soybean planted acreage projection to 85.23 million versus 84.54 million a month ago. If realized Informa’s forecast would exceed 2015 planted soybean acreage by more than 2.5 million acres.
The one question I get asked repeatedly is, “Why would producers look to expand their corn and soybean acreage in 2016 with December 2016 corn futures trading under $4.00 per bushel and November 2016 soybeans futures trading under $9.00 per bushel?”
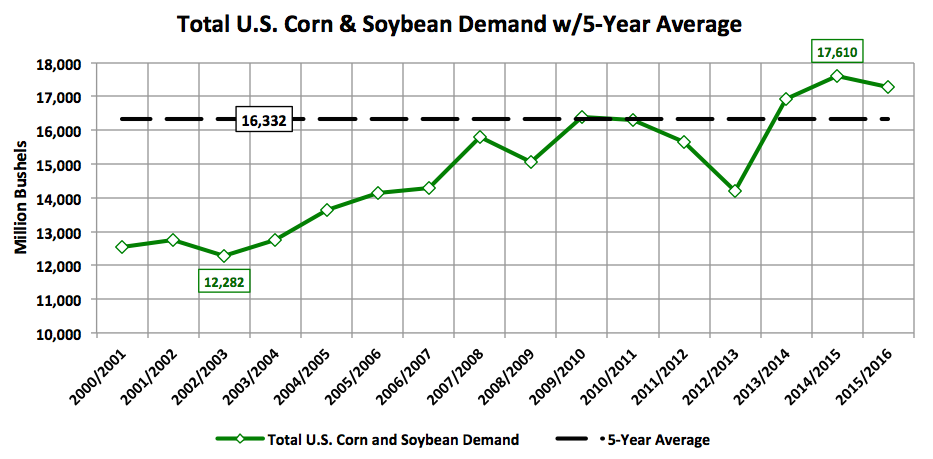
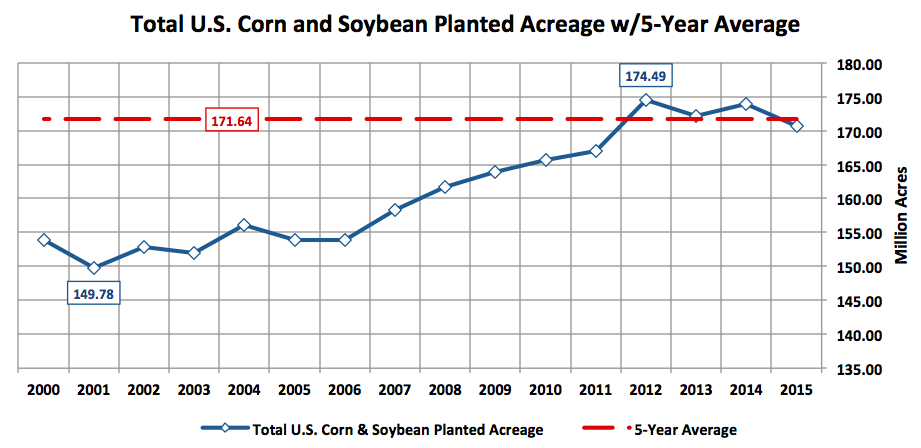
My initial response is quite honestly “that’s a very good question” followed immediately by “it’s complicated.” The reality is since 2000/01 total U.S. soybean and corn planted acreage has grown considerably, increasing a combined 24.7 million acres from 2001 thru 2012 (a 16.5% increase) peaking at a record high of 174.5 million acres in 2012/13. This collective acreage advance made sense for a variety of reasons augmented primarily by a period of consistently high, record-breaking prices, as well as, a massive total demand increase. In fact from 2002/03 thru 2014/15 total U.S. corn and soybean demand grew an incredible 5.328 billion bushels or 43.4%. Therefore substantially higher demand initiated the need for higher price floors to encourage the appropriate acreage response from producers. Farmers not surprisingly obliged with corn futures and soybean futures eventually trading up to new record highs, eclipsing $8.00 per bushel and $17.00 per bushel respectively in 2012. However this historic price advance did not come without a similar explosion in input costs for producers, which leads me to the very predicament many farmers now find themselves in today.
Seed and chemical costs along with land rents have remained stubbornly high in spite of a precipitous drop in corn prices and soybean prices. In 2015 a number of producers in Minnesota and Iowa were still able to cash flow their farming practices despite high input costs combined with low prices due to a record soybean and corn yield. The risk is however going forward that if the 2016 growing season proves to be average or even slightly below average (resulting in trend-line versus record or near-record soybean / corn yields) the breakeven cost for producers in sections of MN and IA specifically will push past $4.00 – $4.25 per bushel in corn and $10.00 – $10.50 per bushel in soybeans. Therefore why would a farmer sustain his/her acreage pattern or even consider expanding it 2016? They’re banking on another 2014 yield performance in the ECB or 2015 yield performance in the WCB to compensate for lower CME prices until the market hopefully cycles back to higher values.
#NoFilter: CORN FUTURES PRICE FORECAST
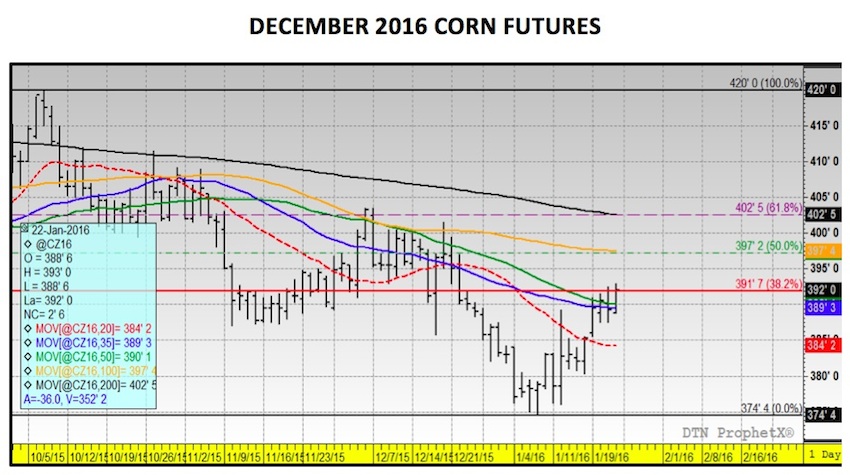
Current March Corn Price Considerations: March corn futures traded up 7-cents per bushel week-on-week, finishing on Friday at $3.70 ¼, which is the highest CH6 has closed since 12/21/2015. Corn Bulls scored three key victories this week:
- Informa’s revised 2016 U.S. corn planted acreage forecast was higher than a year ago, but it was lower than their projection in December. The insinuation then being that December 2016 corn futures trading below $4.00 per bushel is starting to negatively influence prospective planting intentions in certain areas of the Corn Belt.
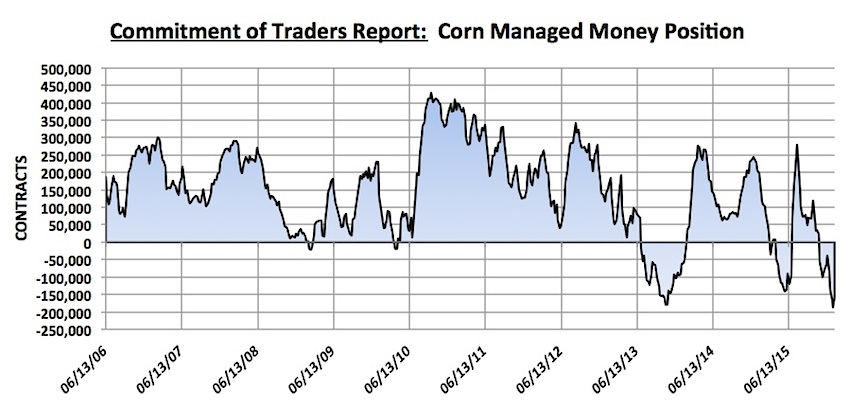
- The Managed Money net short in corn was reduced to -158,210 contracts as of the close on January 19th versus -186,831 the previous week. This represented the 1st time in 4 weeks that money managers were net buyers, which is potentially a sign that the “money” believes” a momentary bottom has been formed.
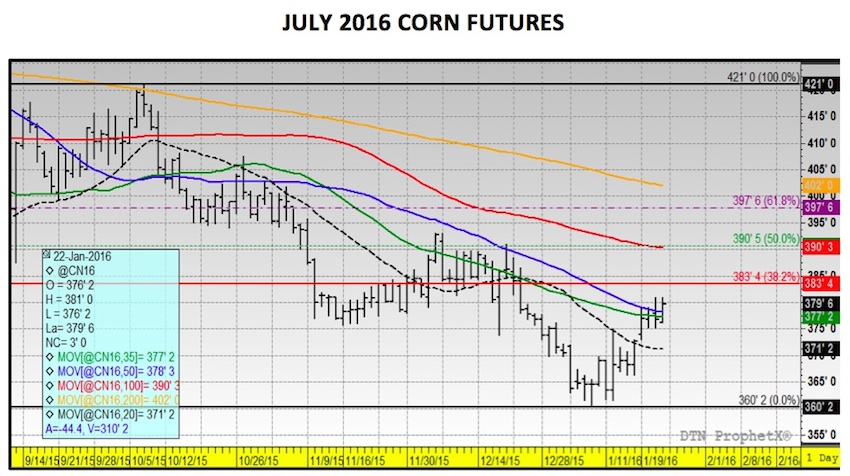
- Friday’s closes in March, July, and December corn futures all featured a decisive push above the 35 and 50-day moving averages in each respective month. Both have previously provided strong resistance on rally attempts going back to October 2015. If corn can once again find some early buying on Monday morning, this rally in corn futures could extend another 10-cents; however a move beyond that will require a close over both the 100 and 200-day moving averages, which figures to be a much more daunting task.
Rallies should still be used as selling opportunities in my opinion. The fundamentals for the corn market remain weighted heavily negative, which favors a “range-bound” trading bias. This recent push higher appears to be nothing more than a short-covering rally versus a true, long-term shift in market sentiment.
Thanks for reading
Twitter: @MarcusLudtke
Author hedges corn futures and may have a position at the time of publication. Any opinions expressed herein are solely those of the author, and do not in any way represent the views or opinions of any other person or entity.
Data References:
- USDA United States Department of Ag
- EIA Energy Information Association
- NASS National Agricultural Statistics Service


")

