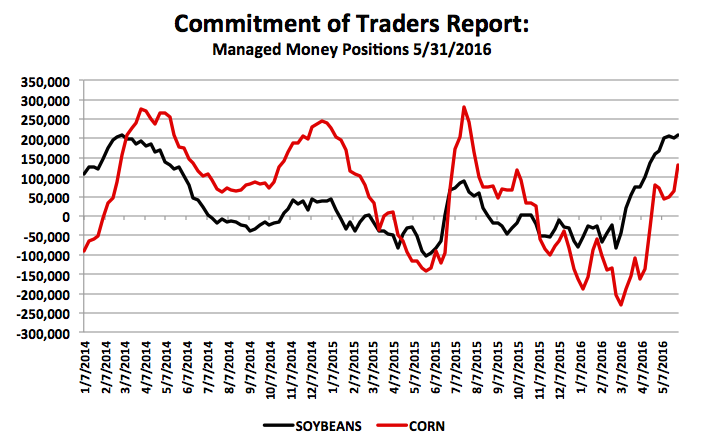
It’s apparent the “money” has now started chasing corn with their soybean exposure already approaching near record length (+208,696). For what it’s worth the record Managed Money long in corn is 429,189 contracts versus just 253,889 contracts in soybeans. Therefore they have plenty of bullets left in corn if they so choose to continue buying corn futures.
Corn Commitment of Traders Report – Managed Money
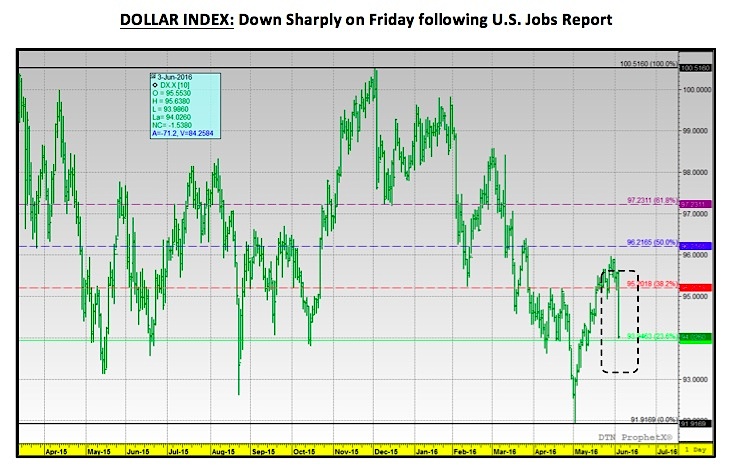
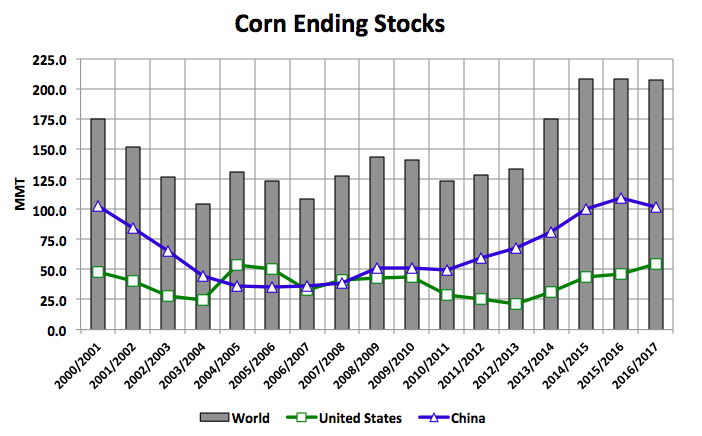
I still can’t find anything fundamentally that remotely supports the current price action in corn or soybean futures. I’ve read all the “stories” regarding crop shortages in Brazil and Argentina and the export demand this has apparently created for the United States. And while it is true that export demand has improved corn fundamentals, as far as corn is concerned, even a 100 million bushel increase to 2015/16 U.S. corn exports doesn’t threaten old-crop ending stocks, which as of the May Crop report were estimated at 1,803 million bushels. Therefore the Jul-Sep spread in my opinion has no business trading at 1 ¾-cents nor should Sep-Dec be trading at even money. This type of spread activity would normally indicate a domestic cash market running out of corn. That couldn’t be further from the truth in the U.S. (current cash basis levels support this assertion). This then continues to tell me this rally has 80% to do with money-flows back into commodities (note the break in the Dollar Index chart below) and 20% to do with real corn fundamentals. At some point this will be an important distinction. Ultimately a rally built on paper typically doesn’t just slowly set back, it breaks hard and fast…

Thanks for reading.
Twitter: @MarcusLudtke
Author hedges corn futures and may have a position at the time of publication. Any opinions expressed herein are solely those of the author, and do not in any way represent the views or opinions of any other person or entity.
Data References:
- USDA United States Department of Ag
- EIA Energy Information Association
- NASS National Agricultural Statistics Service

 Trading Near Top Of Price Range")


