It was a tough week for Corn Bulls with March 2017 corn futures trading down to day low of $3.41 ¾ on Thursday, December 1, its lowest level since September 30, 2016. Will this effect the corn price outlook December? And what precipitated the push to a new 2-month low in March corn futures?
There was one major contributing factor:
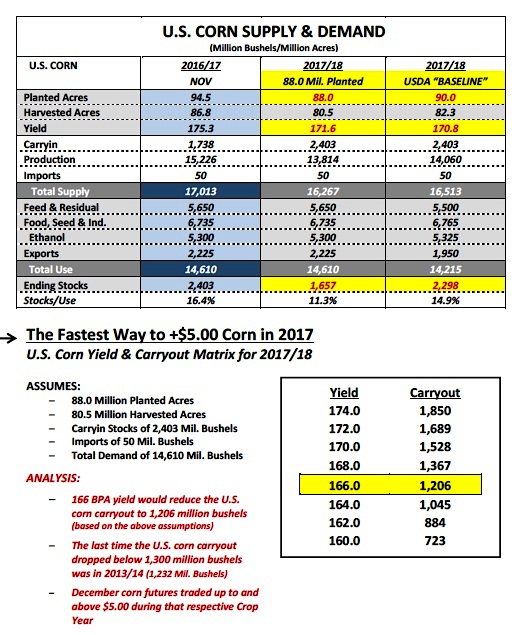
On Tuesday, March corn futures closed down 9 ¼-cents per bushel, closing at $3.49. The meltdown on Tuesday coincided with the release of the USDA’s “Baseline” U.S. corn S&D table for 2017/18, which showed U.S. planted corn acreage falling to 90 million acres in the spring of 2017. Despite the 4.5 million acre reduction versus 2016/17, the USDA’s data indicated projected 2017/18 U.S. corn ending stocks of 2,298 million bushels. This would represent a crop year-on-crop year carryout decline of only 105 million bushels (see full Baseline U.S. Corn S&D forecast on page 2). That type of carryout estimate would still represent one of the largest U.S. corn ending stocks figures in the past 30-years.
What were Corn Bulls hoping for? That’s an excellent question…traditionally the USDA’s “Baseline” estimates have offered nothing but conservative, trend-line forecasts for both yield and usage. Therefore the USDA’s figures in my opinion simply reflected largely what the market should have already been anticipating, which was massive carryin stocks of 2,403 million bushels and a trend-line U.S. corn yield in 2017/18 of 170.8 bushels per acre, equating to a stocks scenario very similar to 2016/17. The carryin stocks/yield combination, even with the decrease in planted acreage, still penciled out to total U.S. corn supplies of 16,513 million bushels (2nd largest on record). Additionally, it should have been assumed the USDA would not offer a U.S. corn yield estimate below 170 bushels per acre in its Baseline S&D forecast considering the average U.S. corn yield the past 3-years has been a remarkable 171.6 bpa (2014/15 = 171 bpa, 2015/16 = 168.4 bpa, and 2016/17 = 175.3 bpa).
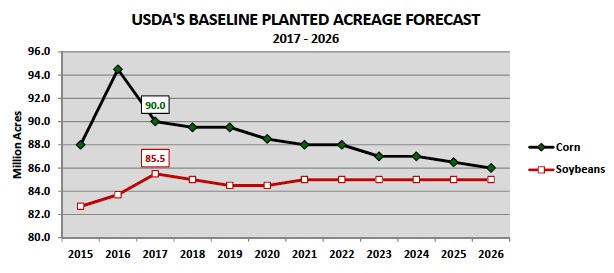
If there were 2 areas of disappointment for Corn Bulls the first was probably that the USDA didn’t lower planted corn acreage more than 4.5 million acres versus 2016/17. I have seen private estimates as low as 88 million (-6.5 million acres versus 2016/17). I think a strong case can be made that the current new-crop soybean/corn price ratio (SX7/CZ7; see page 6) of 2.69 clearly supports more soybean acres in 2017 at the expense of corn acres with December 2017 corn futures trading below the breakeven cost of production in several areas of the Corn Belt (CZ7 closed at $3.77 ¾ on Friday). The USDA seemed to agree on Tuesday by estimating 2017/18 U.S. soybean planted acreage at 85.5 million acres (new record high) versus 83.7 million 2016/17. The question now is will future CME corn and soybeans futures price adjustments dictate even more of an acreage shift to soybeans as the 2017 spring planting season approaches? Only time will tell…
And secondarily, the USDA’s total demand figure for 2017/18 projected usage down 395 million bushels. Specifically the USDA’s demand forecast showed U.S. corn exports falling to 1,950 million bushels in 2017/18, down 275 million from their current projection for 2016/17. Why is the USDA expecting a 12% decrease in U.S. corn exports? The USDA is anticipating Brazil’s corn production to recover from a devastating drought in 2015/16, which lowered Brazil’s available corn exports to 16.5 MMT that crop year (versus 34.46 MMT in 2014/15 and 25.5 MMT for 2016/17; Brazil is the world’s 2nd largest corn exporter). The recent surge in 2016/17 U.S. corn export sales has been attributed to the lack of Brazilian corn exports; however that trend should begin to correct downward in 2017 as the size of Brazil’s safrinha corn crop becomes more definable. I would assume that is why the USDA chose to lower their export forecast so aggressively for 2017/18. It’s worth noting that in 2014/15 and 2015/16 U.S. corn exports averaged 1,862 million bushels. Therefore it appears the USDA is simply expecting a reversion back closer to 2014/15 and 2015/16 export levels assuming normalized Brazilian corn production.
How much “stock” should the market put in the USDA’s “Baseline” forecast?
Minimal. A lot can and will change between now and the first week of April when U.S. farmers begin planting corn in the Eastern Corn Belt. This remains just a “paper” forecast of an S&D that will continue to evolve due to futures prices, input prices, and weather (both U.S. and South America). Therefore despite the recent selling pressure I see no need to get Bearish at or below $3.80 in December 2017 corn futures. As my data shows a few minor downward tweaks to both acreage and yield, along with a continuation of 2016/17 U.S. corn demand trends is all it takes to create a much tighter carryout projection and higher price floor for corn futures in 2017.
KEY CH7 PRICING CONSIDERATIONS FOR THE WEEK ENDING 12/2/2016:
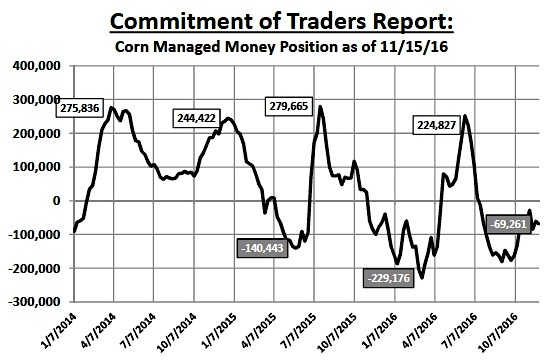
March corn futures (CH7) closed on Friday (12/2) at $3.47 ¼, finishing down 11-cents per bushel week-on-week. Technically CH7 did hold key support at $3.416, the 61.8% Fibonacci retracement level from the day low and harvest low of $3.25 on August 31st versus the day high of $3.69 on October 20th. However that wasn’t much consolation for Corn Bulls who witnessed 3 consecutive closes below all the major moving averages (20, 35, 50, and 100-day) from Wednesday through Friday. Other than the USDA’s price negative “Baseline” U.S. corn S&D forecast for 2017/18, additional overhead resistance has been felt from a resurgence in the U.S. Dollar Index (see page 6), which traded up to its highest level since March of 2003 on November 24th. Furthermore Friday’s Commitment of Traders report showed Money Managers increasing their net short corn position exposures week-on-week to -69,261 contracts as of the market close on 11/29/2016. Clearly all of these price drivers have shaped the majority market bias in corn futures to sideways to LOWER for the time being.
continue reading on the next page (corn futures price outlook)…


