December corn futures consolidated this week into a relatively narrow 10-cents per bushel, high-to-low trading range ($3.42 ¼ – $3.32 ¼).
This type of price action is not atypical for the month of September, especially in years where the market is anticipating a record to near record U.S. corn yield, along with elevated U.S. corn ending stocks. 2016/17 certainly fits that description with the USDA currently forecasting a U.S. corn yield of 174.4 bushels per acre (which if realized in January would eclipse the current record of 171.0 bpa from 2014/15) and U.S. corn ending stocks of 2,384 million bushels (largest since 1987/88).
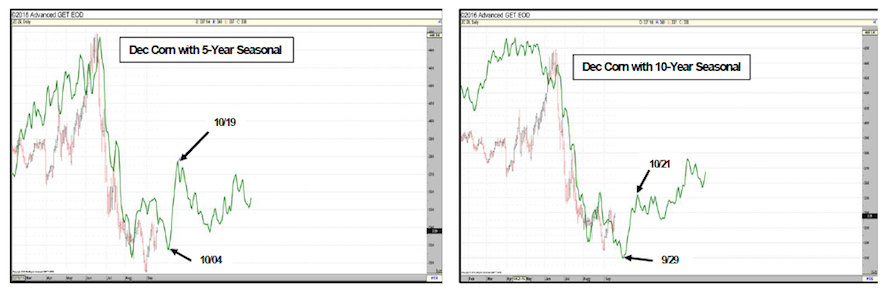
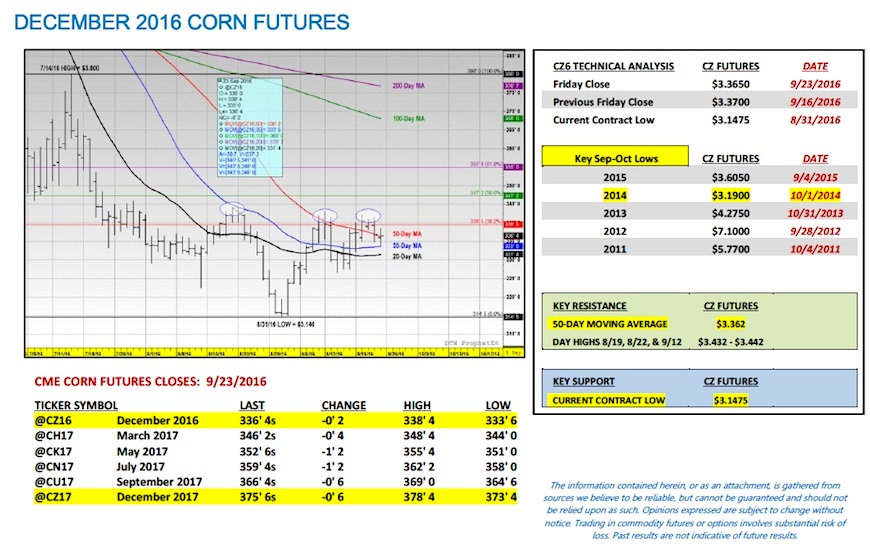
That said the primary discussion topic at the moment continues to surround the question of “Will December corn futures push for a retest of its current contract low of $3.14 ¾ from August 31st going into September month-end?” The 10-year seasonal (see page 3) would argue unequivocally “yes”; however the chart below, which examines the specific December corn futures price action from crop years similar to 2016/17, would suggest there’s no guarantee.
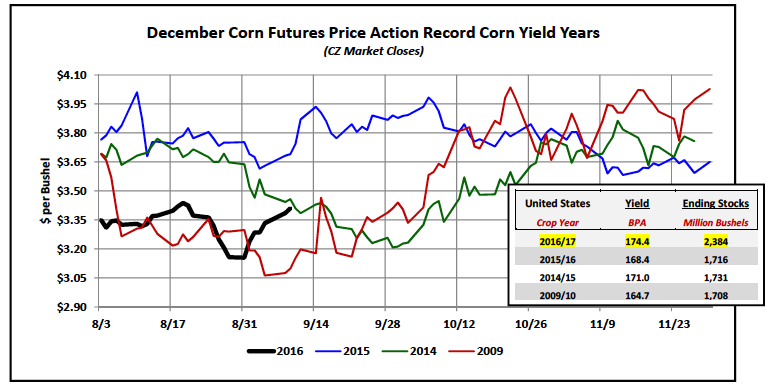
In 2014, December corn futures followed the 10-year seasonal perfectly establishing a harvest and contract low on October 1st at $3.19. Conversely in 2015, December corn futures rallied aggressively into the first week of October achieving a day high of $3.99 ¾ on October 7th (39 ¼-cents above the September 4th day low of $3.60 ½). Both 2014 and 2015 produced record to near record U.S. corn yields and U.S. carryout figures above 1,700 million bushels and yet the market still produced two very different pricing outcomes at the end of September.
Was there any other notable fundamental difference between 2014 and 2015 that might explain the 60-cents per bushel divergence in December corn futures closes on September 30th (CZ closed at $3.20 ¾ on 9/30/14 versus $3.87 ¾ on 9/30/15)? I went back and looked at the USDA’s weekly crop condition reports from both years during the month of September and there was a sizable spread in each crop year’s corn good-to-excellent ratings. At the end of September the 2014 U.S. corn crop was rated 74% good-to-excellent versus 68% in 2015. Additionally in each crop year’s respective October WASDE report, in 2014 the USDA was estimating the U.S. corn yield at 174.2 bpa versus an October yield estimate of 168.0 bpa in 2015. Therefore even though the finalized yield figures for both crop years only ended up 2.6 bpa apart (171.0 bpa in 2014/15 versus 168.4 bpa in 2015/16), in October of 2014 the trade sentiment was considerably more bearish than it was in 2015 based on the assumption that the U.S. corn yield was substantially higher than it would later prove to be.
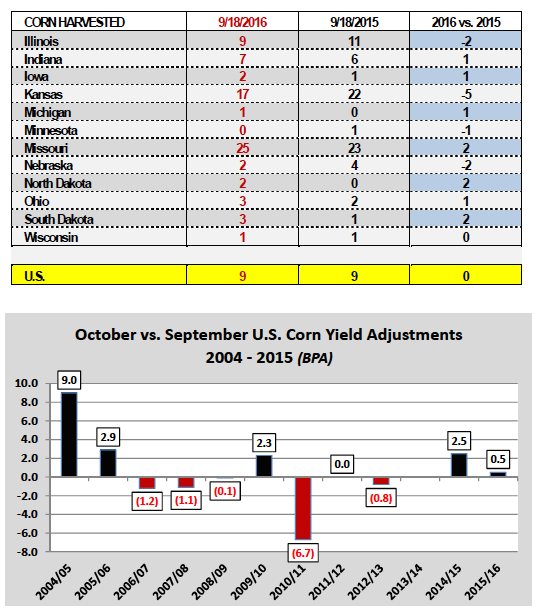
Is any of that information relevant in helping determine what direction December 2016 corn futures will lean this year into the end of September, as well as, early October? I think the easy comparison is to suggest that 2016 is more like 2014 in that with respect to the USDA’s current corn yield estimate of 174.4 bpa combined with a good-to-excellent rating of 74%, on paper they look the same. However the one key difference that I see is that in 2014 the USDA raised its corn yield estimate 2.5 bpa from September to October, which translated into a U.S. corn production estimate still trending higher. This year given the USDA’s latest 0.7 bpa U.S. corn yield reduction in the September 2016 WASDE report, I believe the expectation is that there is now a greater probability of additional yield decreases versus increases in proceeding WASDE reports. Therefore even though, once again on paper, 2016 seems to mirror 2014, the market psychology is decidedly different at the moment especially from a Managed Money perspective where traders tend to focus on the trend in supply or demand as opposed to the pure number and its perceived historical pricing connotation.
Knowing this I believe the current December 2016 corn futures pricing set-up is more in-line with the 5-year corn seasonal (see below), which supports a second wave of Bearish price momentum into the first week of October; however not necessarily a re-test of the current contract low. If the USDA releases an October U.S corn yield forecast at or below its September estimate of 174.4 bpa it should reaffirm a floor in CZ6 at or just below $3.20 per bushel.
That said the more constructive long-term play over the next 60-days appears to be deciding where, when, and how to own December corn futures after CZ6 establishes its next bottom. The December corn futures chart action from the recent analog crop years of 2009, 2014, and 2015 all support an eventual rally in December futures back over a minimum of $3.70 per bushel. In 2009, December corn futures rallied to a day high of $4.13 on 10/23 (September low was $3.05 ¼). In 2014, December corn futures rallied to a day high of $3.77 ¾ on 10/30 (September low was $3.19 ¾). And in 2015, December corn futures traded back up to a day high of $3.80 on 10/27. Therefore all 3 years reflected corn futures prices that over time gravitated back toward $3.75 to $4.00 toward the end of October. This appears to be an opportunity for traders in 2016 as well.
ADDITIONAL KEY PRICING CONSIDERATIONS:
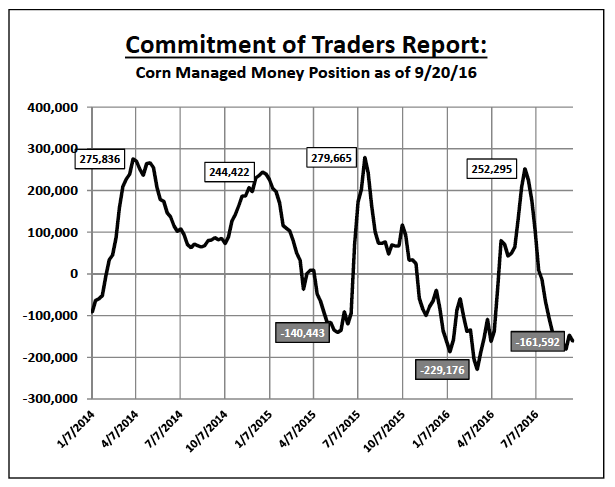
- Friday’s Commitment of Traders report showed the Managed Money short in corn growing 14,650 contracts week-on-week to a net short of -161,592 contracts as of the market close on 9/20/16. At face value this would seem to suggest that more selling is a foregone conclusion during the month of October. HOWEVER…in 2014 Money Managers turned substantial net buyers from 9/30 thru 10/28 of 56,702 contracts despite an equally Bearish U.S. corn S&D profile. In fact on October 28th, 2014 the Managed Money position was reported at a NET LONG of +141,788 contracts.
- November corn options appear well-priced based on Friday’s closes for those looking to get long going into the month of October. November corn option volatility is trading under 22% (very inexpensive). Additionally traders will not pay a premium for time value with November corn option expiration on 10/21/16.
Thanks for reading.
Twitter: @MarcusLudtke
Author hedges corn futures and may have a position at the time of publication. Any opinions expressed herein are solely those of the author, and do not in any way represent the views or opinions of any other person or entity.
Data References:
- USDA United States Department of Ag
- EIA Energy Information Association
- NASS National Agricultural Statistics Service

: Cup (and Maybe Handle) Watch")
 Reaches Important Price Support")

