#NoFilter: PRICE FORECAST: MARCH CORN FUTURES
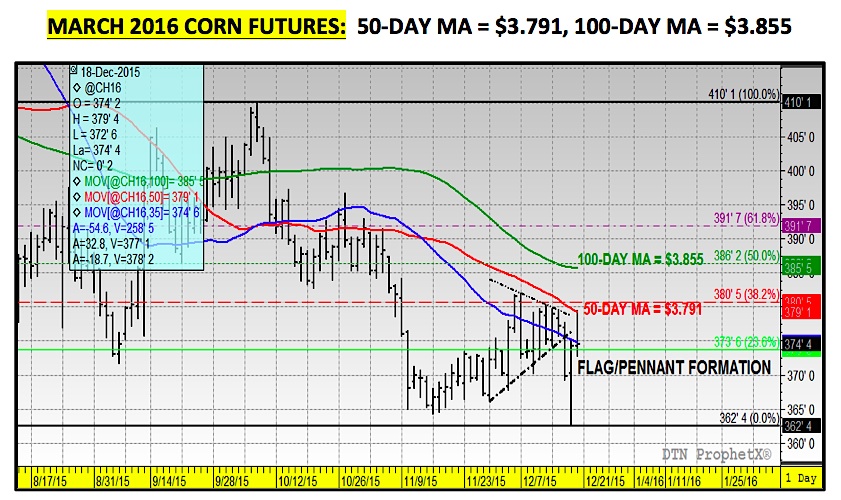
March corn futures managed to rally back to a day high of $3.79 ½ on Friday, momentarily pushing through the 50-day moving average in the process; however I’m still not seeing the required follow through, “buy-stop” paper above these key resistance areas needed to trigger the next 20-cent move higher.
Take a look at the price action and I’ll discuss further below.
March Corn Futures Price Chart and Analysis
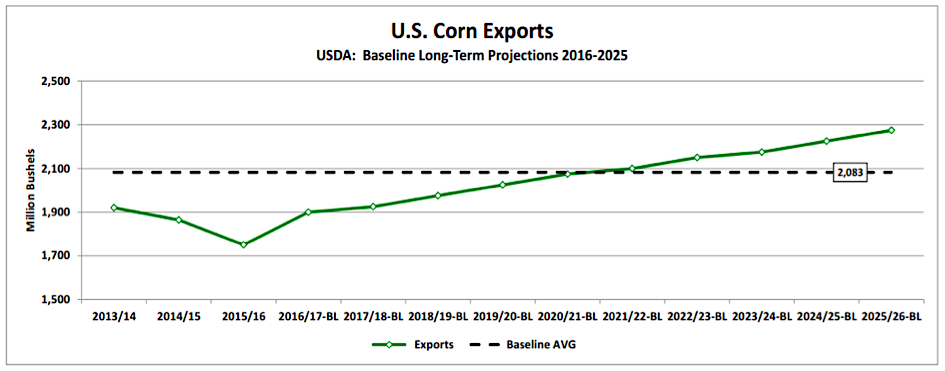
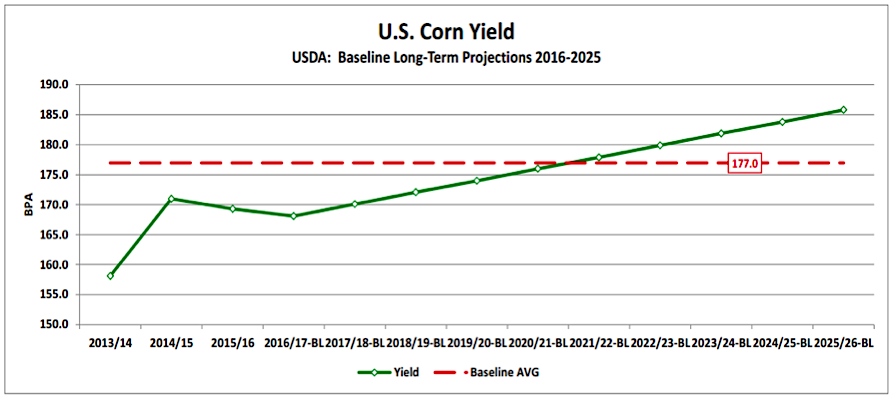
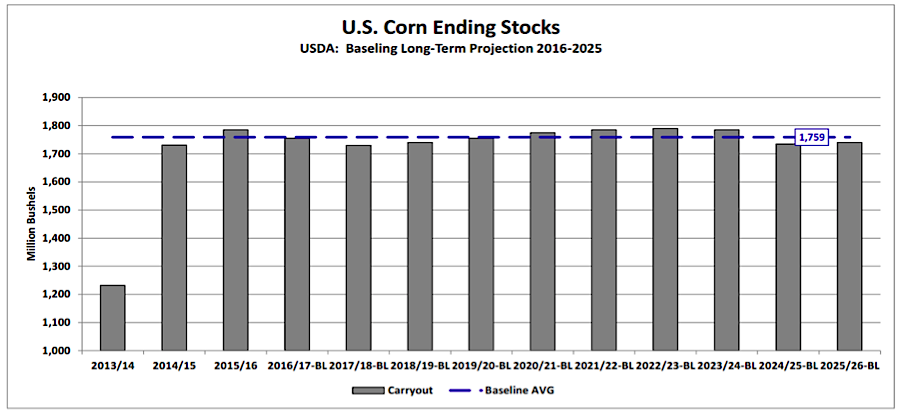
The reasons why are many and partially include my aforementioned comments regarding the Fed and Argentina. That said they run even deeper than that to a certain extent having much to do with the baseline US Corn S&D tables the USDA published last week, which contained the Gov’s generic production and usage projections through 2025. On the following pages I’ve included several charts showing the USDA’s expected figures for planted corn acreage, corn yield, ending corn stocks, corn-ethanol demand, feed & residual use, and corn exports (see a few more charts further below). Some of the highlights are as follows:
- The USDA’s acreage estimates actually show a slow decline in planted corn acreage over time with 2025/26 acreage estimated at 88 million. However even with sideways to slight decreases in planted corn acreage, the USDA is still projecting adequate supply growth by virtue of continued yield advances.
- The demand side of the equation is much more problematic for Corn Bulls. The most dynamic demand sector over the last 10-years has undeniably been the explosion in corn-ethanol demand, which has at times propelled corn futures and initiated the need for higher price floors (to incent the acreage expansion and yield increases necessary to meet what has been a material increase in total U.S. Corn demand). That window now appears to be closing. The USDA is projecting 2025/26 U.S. corn-ethanol demand of 5,000 million bushels, 200 million bushels BELOW the current forecast for 2015/16. This means that demand led rallies will now likely be relegated to growth in U.S. corn exports and/or feed usage. And despite the USDA projecting U.S. corn exports of 2,275 million bushels and feed & residual use of 6,225 million bushels in 2025/26 (up a combined 1,450 million versus 2015/16), I’m not confident the Managed Money investor is going to believe either forecast given the under-performance of both over the last several years.
Friday’s close in March corn futures at $3.74 ¼ was yet another indictment against corn’s ability to sustain a rally. Corn had every opportunity from a technical standpoint to generate a close over $3.80 following the quick recovery and push through the 50-day moving average Friday morning ($3.791), just one-day removed from establishing new contract lows. New lows followed by a higher close usually serves as a strong indicator of a market that was oversold, having exhausted the downside. And yet there still wasn’t enough “panic” from money managers to cover their remaining short positions. The fundamentals remain overwhelmingly negative and have proven thus far to be too much to overcome even with a more supportive price seasonal heading into Q1 2016. The coming week or two could prove important in developing a short-term direction.
Thanks for reading.
Twitter: @MarcusLudtke
Any opinions expressed herein are solely those of the author, and do not in any way represent the views or opinions of any other person or entity.
Data References:
- USDA United States Department of Ag
- EIA Energy Information Association
- NASS National Agricultural Statistics Service

: Worrisome to Broader Market?")

