Weekly Price Action Review in December 2016 Corn Futures (as of Thursday’s Close at $3.71 ¼)
Extreme price volatility in corn futures continued this week with December corn futures initially attempting to recover a small percentage of last week’s excessive losses early Tuesday morning (CZ6 closed down 54 ½-cents per bushel the week ending 6/24); however that bounce was stymied by immediate topside resistance at the 50-day moving average of $4.06. That same afternoon December corn futures limped to the finish line, closing unchanged at $3.94.
The very next day Corn Bulls were forced to emphatically wave the white flag. December corn futures closed sharply lower at $3.83, well below both the 100 and 200-day moving averages. The 100-day moving average in particular had been the last major price support to exhibit any signs of measurable stability. The abrupt change in narrative has altered the summer corn outlook for many analysts. This has no doubt been a massive and abrupt downward correction in corn futures.
However Monday through Wednesday’s price action proved but a prelude to the market shock that ensued following the release of the USDA’s June Acreage and Stocks reports on Thursday at 11:00 a.m. CST. Historically speaking, these two corn reports have been synonymous with major price swings over the last several years. In fact in 7 out of the past 8 years the average December corn futures price adjustment on the day of their release has been 28-cents per bushel. This year’s surprise certainly didn’t disappoint. On Thursday CZ6 traded from a day high of $3.87 ¾ to a day low of $3.65 ¼ before ultimately closing down 11 ¾-cents at $3.71 ¼. The day low in CZ6 came within 1 ¼-cents of the current contract low of $3.64, which was established on April 1st, 2016.
Talk about a change of narrative for the summer corn outlook… in just 2 weeks!
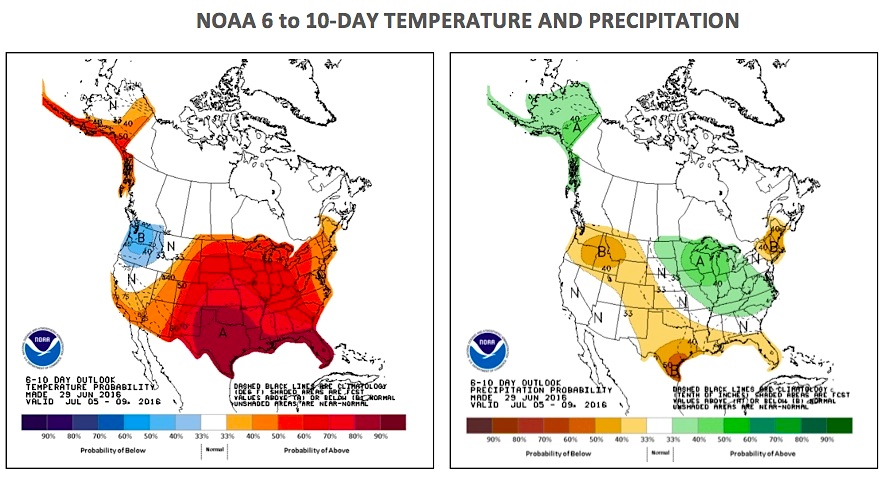
Therefore to summarize, December corn futures traded from a 23-month high of $4.49 on 6/17 to essentially a re-test of the current contract low on 6/30 (equating to an 83 ¾-cents per bushel sell-off) in just 10-trading sessions. By comparison the rally that preceded this price correction, up to the aforementioned day high of $4.49 on June 17th, required a total of 55-trading sessions. What took Corn Bulls more than 2-months to build was entirely wiped out in matter of days by a slightly wetter/cooler forecast, which in turn ignited a tsunami of Managed Money selling.
What were the key takeaways from the June Acreage and Stocks reports? The revisions to the USDA’s 2016 planted corn acreage estimate, as well as, its June 1 corn stocks forecast were undeniably bearish for corn prices and the summer corn outlook.
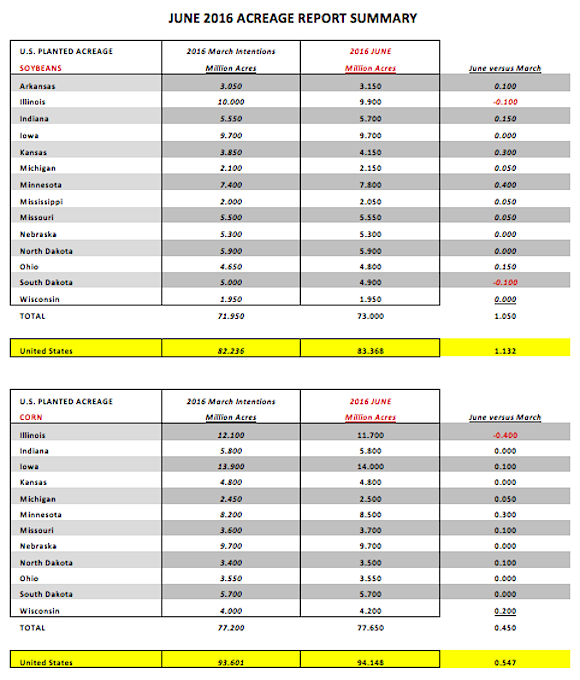
June Corn Acreage – In arguably the biggest surprise contained in the report, the USDA increased total planted corn acreage to 94.148 million acres versus the March Intentions estimate of 93.601 million (+547k acres) and the average trade guess of 92.896 million (+1.252 million acres). The trade was anticipating a reduction in corn acreage due in large part to the accelerated spring rally in November soybean futures, which culminated in SX6 trading above $10.75 per bushel on May 10th and 11th versus a December corn futures market that was still trading below $3.95 per bushel at that time. The new-crop soybean (SX6)/ corn (CZ6) ratio widened to 2.77 on May 11th. The CME “board” economics in theory clearly favored switching corn acres to soybean acres especially in sections of the Corn Belt experiencing corn planting delays. States such as Indiana and Ohio certainly fit that description; however in the June Acreage report both Indiana and Ohio’s acreage estimates remained unchanged versus the USDA’s March Intentions forecast (full state-by-state breakdown on page 6). In fact of the top 12 corn producing states in the country only Illinois saw its planted corn acreage forecast lowered versus March (-400k acres to 11.7 million).
How accurate is the USDA’s June Acreage forecast? In 4 out of the past 5 crop years, the USDA’s final acreage assessment in the January Crop report has been LOWER than the June estimate by an average of -1.08 million acres. The largest June-to-Final planted acreage decrease over that time period came in 2013/14 when U.S. planted corn acreage was reduced from 97.379 million acres in June to 95.365 million in January (-2.01 million). The problem for Corn Bulls is that revelation if proven to be true again for 2016 won’t be known for several months. As it stands today, the market perceives that 2016/17 U.S. corn ending stocks will now increase to at least 2.118 billion bushels in the July 2016 WASDE report by virtue of the planted corn acreage increase alone. That has clouded the summer corn outlook while dragging prices lower.
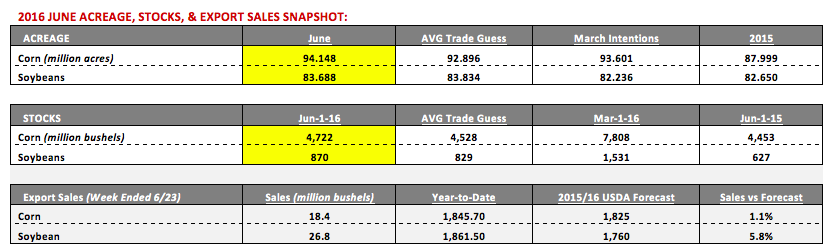
June 1 Corn Stocks – June 1st, 2016 corn stocks were reported at 4,722 million bushels versus 4,528 million in 2015 and the average trade guess of 4,453 million (charts on page 5). In fact the USDA’s figure exceeded even the high-end of pre-report trade guesses, which was 4,650 million. The corn stocks number clearly supports the assertion that the USDA has been overestimating 2015/16 U.S. corn feed demand. The practical implications of this will likely be an increase to the 2015/16 U.S. corn carryout in the July 2016 WASDE report, which will also then raise 2016/17 U.S. corn carryin stocks by an equal amount. Some analysts are now speculating that the combination of higher planted corn acreage and larger carryin stocks could push 2016/17 U.S. corn ending stocks above 2.3 billion bushels.
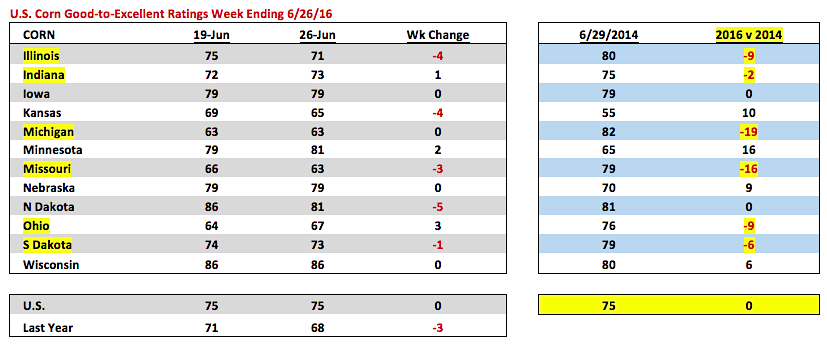
U.S. CORN CONDITION UPDATE: In Monday’s Weekly Crop Progress report the 2016 U.S. corn crop was rated 75% good-to-excellent as of June 26th, unchanged from the previous week and 7% better than 2015. For the 2nd consecutive week the market was expecting to see a 1 to 2% decline in ratings. There was a notable 4% decrease in Illinois’s good-to-excellent rating (71% versus 75% on 6/19); however of the other top 4 state producers, both Iowa and Nebraska’s good-to-excellent ratings remained unchanged at 79% with Minnesota up 2% to 81%.
Corn Bulls continue to suggest the USDA’s current national rating is too high given its historical correlation to 2014 and its final record corn yield of 171 bushels per acre. On June 29th the 2014 U.S corn crop was also rated 75% good-to-excellent (equal to this year’s crop) therefore insinuating the possibility of a final 2016 U.S. corn yield above 170 bpa this fall. Is the 2016 U.S. corn crop really as good as the one harvested in 2014? I believe there are some key differences that may yet play out in the summer corn outlook:
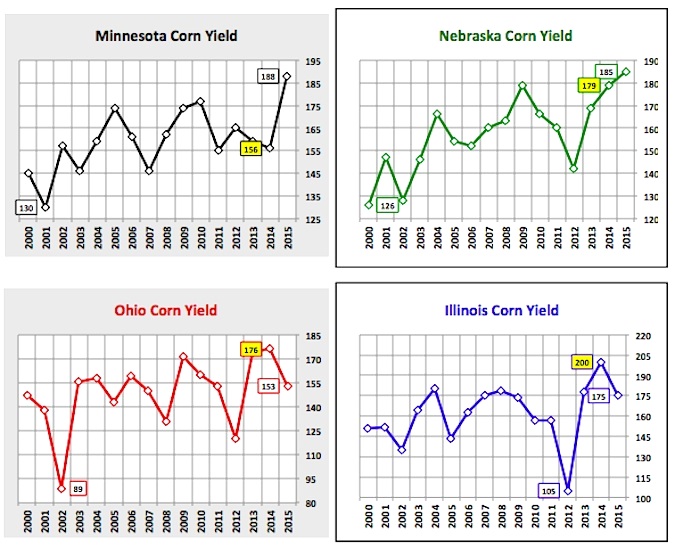
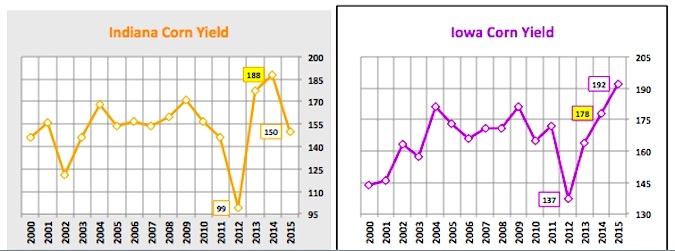
- In 2014 the Eastern Corn Belt produced record state corn yields in Illinois (200 bpa), Indiana (188 bpa), and Ohio (176 bpa). Illinois and Indiana in particular (the 2nd and 5th largest state corn producers respectively) obliterated their previous record yields by a combined average of 15.5 bpa. As of 6/29 in 2014 Illinois was rated 80% good-to-excellent versus 71% this year, Indiana 75% versus 73%, and Ohio 76% versus 67%. Clearly, as it stands presently, only Indiana would appear in a position to even approach its record state corn yield from 2014. Furthermore both Missouri and Michigan also currently trail their 2014 state corn ratings by more than 15 percentage points each.
- Conversely the one state exhibiting a much better rating than it had in 2014 is Minnesota. As of 6/29 in 2014 Minnesota was rated just 65% good-to-excellent versus its rating this past Monday of 81%. Minnesota’s 2014 state corn yield was 156 bpa, well below trend-line and 32 bpa BELOW its eventual record yield of 188 bpa established in 2015.
Overall, based on the first-hand observations I’ve received from both the Western and Eastern Corn Belts, I’m not ready to put this year’s corn crop on par with 2014. The ECB in particular was nearly perfect in 2014, and even though Minnesota’s likely to add bushels to the national yield in 2016 versus its disappointing performance in 2014, I don’t think it will be nearly enough to offset the highly variable growing conditions in Illinois, Indiana, Ohio, Michigan, and Missouri. I’m still in the camp believing that based on what we know today, the U.S. corn yield is in the 162 to 165 bpa ranges versus 168 to 171 bpa. Make no mistake at 165 bpa that would still be a very good yield outcome for 2016 and in my opinion wouldn’t support corn futures trading above $4.25 CZ6.
Corn Futures (CZ6) PRICE FORECAST: December corn futures still have plenty of possibly bearish S&D related considerations to digest, including a significant increase to 2016/17 U.S. corn ending stocks by virtue of larger planted acreage and carryin stocks. Additionally there remains no immediate weather threat with July corn pollination quickly approaching, which has now fostered discussions of a potential repeat national yield performance similar to 2014/15 (171 bpa). The other negative for Corn Bulls is the existing Managed Money long position, which some traders believe still remains in excess of 140,000 contracts (inclusive of this week’s sell-off). HOWEVER, has corn broken too far too fast? In my opinion yes, the market is oversold. Furthermore the new-crop soybean (SX6)/ corn (CZ6) ratio has exploded to over 3.0 since the market closes on Thursday. Therefore the current price skew between November soybean futures and December corn futures would favor “buy corn/sell soybeans” type programs, with traders looking to take advantage of that ratio coming back into a more reasonable historical alignment.
It’s been well stated in my previous columns that I never believed the rally to $4.49 in CZ6 was anything more than paper price support betting on a La Niña. Therefore I’m not surprised the market collapsed. However I do believe the market’s now overdone it. That said sustainable rallies should now prove extremely difficult as the summer corn market outlook fights uncertainty. Considering CZ6 has just broken nearly 85-cents per bushel (losing 19% of its total value) in 10-trading sessions my assumption is buyers will prove extremely cautious and reluctant to overextend themselves on the long side (technical overview on page 8). Overall I believe this favors a more range bound market with strong topside resistance versus additional sharp moves lower for the time being.
Corn Ratings, Weather, Yields, & More…
Thanks for reading.
Twitter: @MarcusLudtke
Author hedges corn futures and may have a position at the time of publication. Any opinions expressed herein are solely those of the author, and do not in any way represent the views or opinions of any other person or entity.
Data References:
- USDA United States Department of Ag
- EIA Energy Information Association
- NASS National Agricultural Statistics Service
")

 Trading Near Top Of Price Range")
")
