CMC 2016 August U.S. Corn Production Forecast
This week I wanted to issue my first official national and state-by-state corn production (yield) estimates in advance of the USDA’s August 2016 WASDE report. Note that this report will be released on Friday, August 12th. It’s been a rough month for Corn futures and Corn ETFs (NYSEARCA:CORN) so be sure to also read my December Corn Futures (CZ6) price outlook further below.
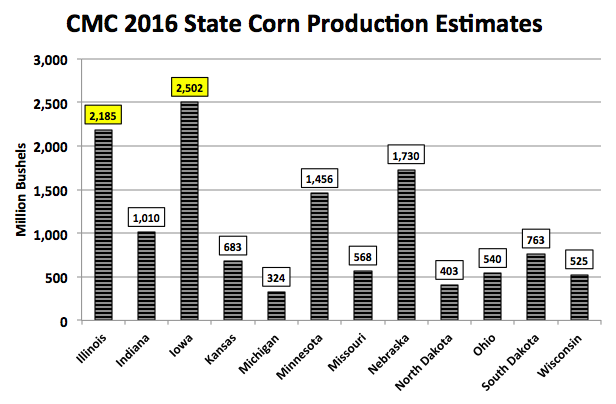
As of the USDA’s latest Weekly Crop Progress report, which showed the U.S. corn crop still rated a remarkable 76% good-to-excellent, I’m projecting a 2016/17 U.S. corn yield of 170 bushels per acre. This would represent a 2 bpa increase versus the USDA’s July yield forecast of 168 bpa. If realized, total U.S. corn production would improve to 14,711 million bushels, up 171 million bushels month-on-month.
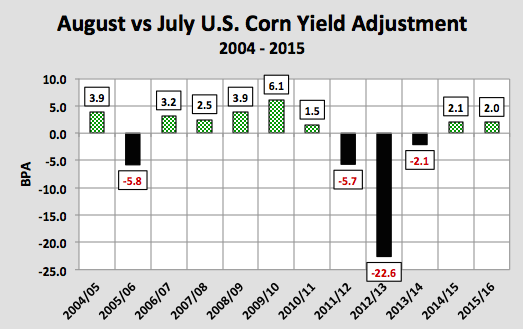
Why a 2 BPA increase? Since 2004 the USDA has increased the U.S. corn yield 8 times in the August WASDE report. The average August yield increase is +3.2 bpa. Note that the largest increase was +6.1 bpa in Aug-2009. More recently in 2014 and 2015, the August yield increases equaled +2.1 bpa and +2.0 bpa respectively. With this year’s corn crop now rated 1% better than 2014’s record yield producing growing season (final yield of 171 bpa), I would argue the USDA’s current U.S. corn good-to-excellent rating supports a minimum 2 bpa increase for this report.
Additionally, all of the top 5 U.S. corn producing states have seen their good-to-excellent ratings improve since the 1st week of June.
- Illinois’s good-to-excellent rating has increased 6% (76% to 82%).
- Indiana’s good-to-excellent rating has increased 3% (72% to 75%).
- Iowa’s good-to-excellent rating has increased 2% (80% to 82%).
- Minnesota’s good-to-excellent rating has increased 7% (77% to 84%).
- Nebraska’s good-to-excellent rating has increased 1% (78% to 79%).
Therefore regardless of those offering what I believe to be valid counter-arguments suggesting the U.S. corn yield will eventually prove NOT as good as advertised, those revelations probably won’t be reflected until either the October or November WASDE reports.
In fact during the 2014 growing season, the 2014/15 U.S. corn yield estimate didn’t peak until the October WASDE report at 174.2 bpa. It was then eventually lowered to 171.0 bpa in January after the corn crop was fully harvested. This underscores the point, that as long as the national good-to-excellent rating in corn remains equal to or better than 2014 and Midwest weather remains a non-factor, it will be very hard for the USDA to justify a U.S. corn yield estimate substantially less than 2014’s in either the August or September 2016 WASDE reports.
State-by-State Corn Yield Profile: The two most critical states in my opinion are Iowa and Illinois. Collectively they have the ability to push the needle on the national corn yield (up or down) by 2 to 3 bushels per acre. To provide an order of magnitude regarding IA and IL’s corn production capacity, together they produce more corn than Brazil and Argentina combined (the world’s #2 and #3 largest corn exporters). Therefore if the U.S. is going to achieve a record corn yield in 2016, it’s likely going to require above-trend corn yields in both states.
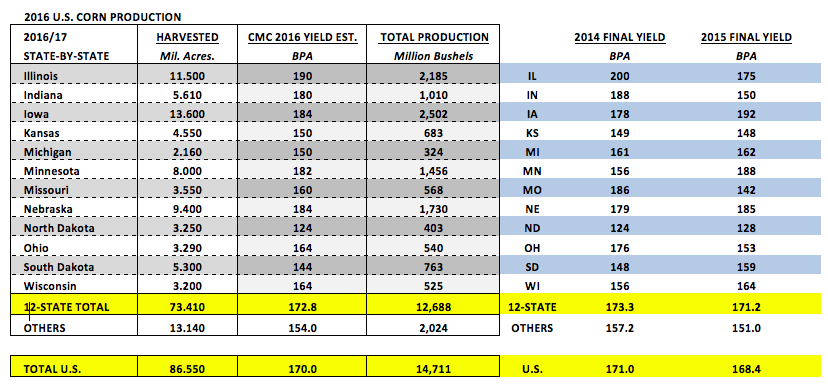
That said I’m currently forecasting Illinois’s 2016 state corn yield at 190 bpa. This is 10 bpa BELOW its record yield established in 2014 (200 bpa) and 12 bpa ABOVE its yield from a year ago (178 bpa). Illinois’s latest good-to-excellent rating in corn of 82% is equal to where it was rated in 2014. However in 2014, 30% of IL’s corn crop was rated excellent (as of 7/27/14) versus just 24% this year. It’s also worth noting that IL’s 2nd highest state corn yield was 180 bpa from 2004. Therefore I’m not quite ready to put Illinois’s 2016 corn crop on par with 2014.
I’m currently forecasting Iowa’s 2016 state corn yield at 184 bpa, which would be 8 bpa BELOW its record yield established in 2015 (192 bpa) and 6 bpa ABOVE its yield from 2014 (178 bpa). Iowa’s latest good-to-excellent rating in corn of 82% is 1% less than where it was rated a year ago. Therefore, similar to Illinois, I’m not prepared to endorse an Iowa state corn yield equivalent to 2015.
How would the national corn yield (and production) be affected by future 5% yield adjustments in Iowa and Illinois versus my current August estimates? A 5 % yield increase in Illinois (199.5 bpa) and Iowa (193.2 bpa) would push the U.S. corn yield up to 172.7 bpa. It would also increase total U.S. corn production to 14,946 million bushels.
Conversely, a 5% yield decrease in Illinois (180.5 bpa) and Iowa (174.8 bpa) would drop the U.S. corn yield to 167.3 bpa. It would also decrease total U.S. corn production to 14,477 million bushels. As it relates to 2016/17 U.S. corn ending stocks (assuming total demand stays static versus the USDA’s July forecast of 14,200 million bushels), the carryout range inclusive of both yield adjustments equates to a low of 2,018 to a high 2,487 million bushels. This would likely send a signal to Corn Bulls. Even if the U.S. corn yield is eventually revised lower in the October through January WASDE reports, a U.S. corn yield of 167.3 bpa still leaves U.S. corn ending stocks above 2,000 million bushels. That doesn’t support December corn futures above $3.70 per bushel.
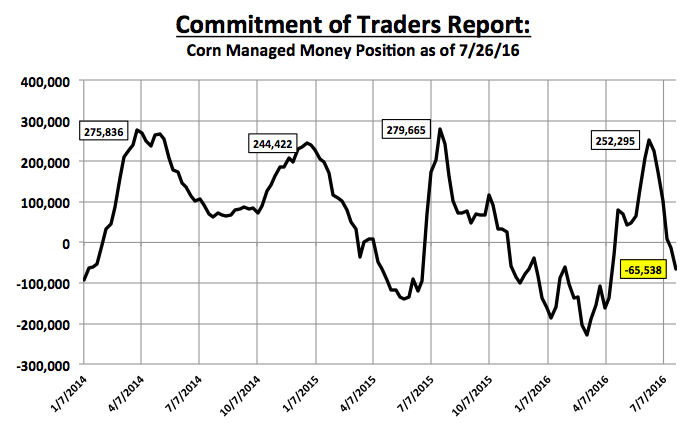
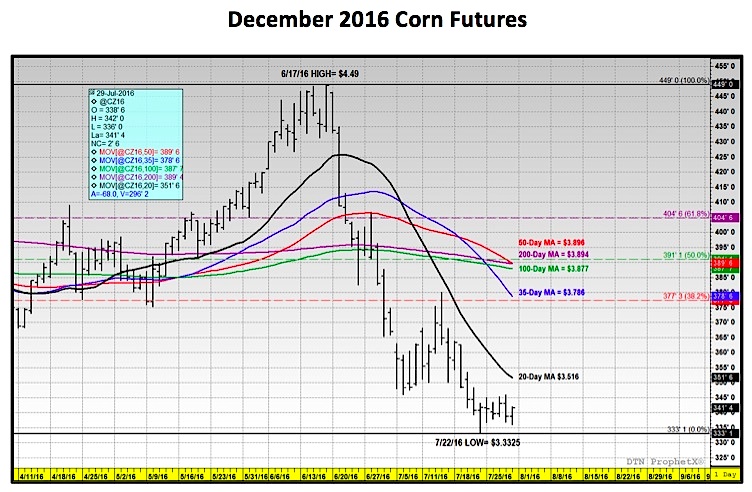
DECEMBER CORN FUTURES (CZ6) PRICE OUTLOOK: This week’s December corn futures trading range was anemic. The high-to-low trading range was only 10-cents ($3.46 to $3.36). Friday’s close at $3.42 ¾ did however represent a 1-cent higher weekly close. Furthermore CZ6 held last week’s new contract low of $3.33 ¼ despite the lack of any significant trend change in market fundamentals, which remain decidedly bearish. Additionally the latest Commitment of Traders report showed the Managed $ net short position in corn increasing to -65,538 contracts. This is its largest net short since 4/12/2016. Money managers were sellers of 52,177 contracts week-on-week as of the market close on 7/26. And yet for the moment, CZ6 corn futures have shown some ability resist moving much below $3.40.
Will CZ6 continue to find support at $3.40? If November soybeans can manage to hold $10.00 per bushel it should help. They accomplished this on Friday, closing up 14 ¾-cents per bushel for the week at $10.03. Ultimately however, until the market perceives U.S. corn yield and production potential have peaked for 2016, rallies should prove very difficult to sustain. There’s still nothing I see in the 8 to 14-day forecast for the Corn Belt that’s going to cause U.S. corn ratings to move aggressively lower. 20 and 30-cents rallies in corn futures will likely require some tangible deterioration in crop condition ratings. Until that happens I still see CZ6 continuing to trade in a sideways trading range ($3.30 – $3.50).
Thanks for reading.
Twitter: @MarcusLudtke
Author hedges corn futures and may have a position at the time of publication. Any opinions expressed herein are solely those of the author, and do not in any way represent the views or opinions of any other person or entity.
Data References:
- USDA United States Department of Ag
- EIA Energy Information Association
- NASS National Agricultural Statistics Service


 – Warren Buffett’s Biggest Holding!")


