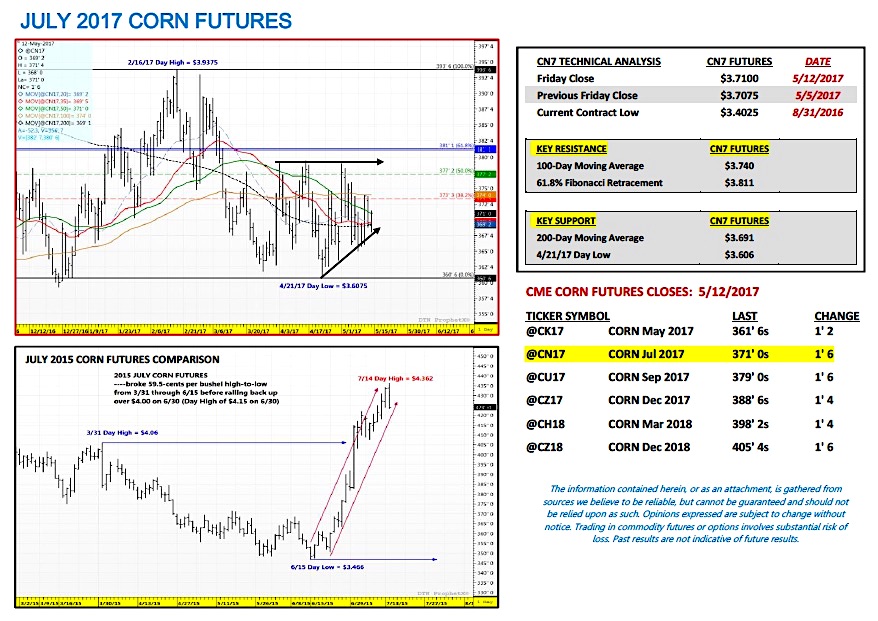
July corn futures moved slightly higher this week, closing up a ¼-cent per bushel week-on-week, finishing on Friday (5/12) at $3.71.
Corn futures essentially treaded water with both corn planting progress and the May 2017 WASDE report offering few if any meaningful surprises.
Weekly Corn Price Drivers (5/8/17 – 5/12/17)
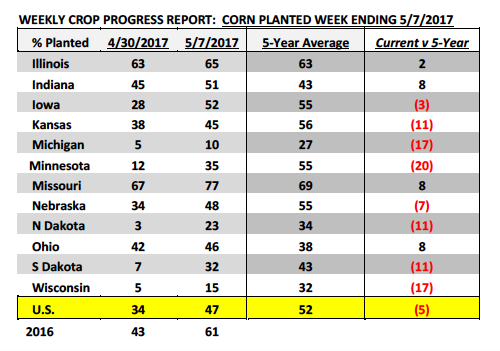
U.S. Corn Planting Progress: Monday’s Crop Progress report showed the U.S. corn crop now 47% planted as of May 7th versus 61% in 2016 and the 5-year average of 52%. The high-end of pre-report trade guesses was 48%. Significant gains were made in the Western Corn Belt. Iowa’s corn planting progress improved to 52% versus 28% a week ago. Minnesota’s corn planting progress improved to 35% versus 12% a week ago. Both states were still trailing their 5-year averages; however both had closed the gap considerably after experiencing planting delays in late April due to persisting cold and wet conditions.
Only minor corn planting gains were made in the Eastern Corn Belt with Illinois’s planting progress improving just 2% week-on-week; however at 65% planted, Illinois was still ahead of its 5-year average of 63%. Overall, given the extended forecast for the Midwest, I now see little reason from purely a “pace of planting” perspective to assume the U.S. can’t achieve a trend-line or slightly above trend-line national corn yield in 2017. Obviously summer weather will have much to say about whether or not that becomes a reality; however the argument that a delayed start to spring planting could lead to a below-trend U.S. corn yield I now believe has lost its momentum given much improved planting progress.
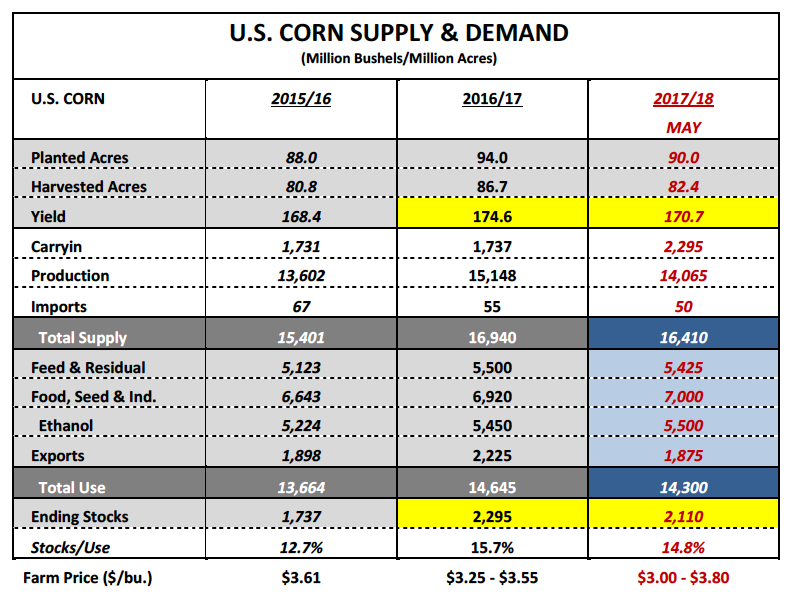
On Wednesday the May 2017 WASDE report was released, which contained the USDA’s first supply and demand balance sheets for the 2017/18-crop year. There were few surprises; however some notable assertions regarding overly optimistic demand projections in my opinion (specifically in soybeans), which I believe were almost premediated on the part of the USDA in an attempt to prevent U.S. corn and soybean ending stocks from ballooning any higher. In corn, the USDA forecasted the 2017/18 U.S. corn yield at 170.7 bpa and harvested acreage at 82.4 million acres for total production of 14,065 million bushels. This compared to last crop year’s record production figure of 15,148 million bushels (174.6 bpa on 86.7 million harvested acres). It should be noted however that in May the USDA’s yield estimate “is based on a weather-adjusted trend assuming normal mid-May planting progress and summer growing season weather, estimated using the 1988-2016 time period.” Point being, not much should be made about the USDA’s current May yield forecast and its relative value going forward.
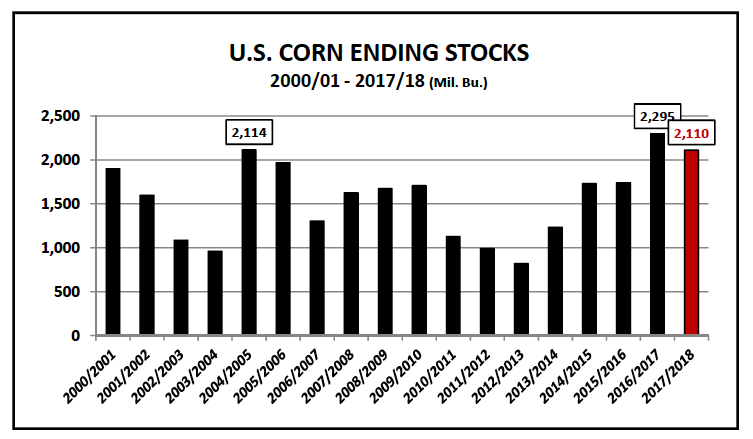
As a point of reference look no further than the 2012/13-crop year when the USDA estimated the U.S. corn yield at 166 bpa in May only to see that yield forecast decimated by an extensive summer drought. By January of 2013 the U.S. corn yield had fallen to 123.4 bpa. That said much can and will happen on the supply side of the equation from now until September. As far as U.S. corn demand was concerned, 2017/18 total U.S. corn use was estimated at 14,300 million bushels, down just 345 million from a year ago. The net result was 2017/18 U.S. corn ending stocks of 2,110 million bushels, which was essentially equal to the average trade guess of 2,122 million bushels and 185 million bushels below 2016/17.
Overall I fully expect the market to shift its attention quickly away from the May WASDE report and back onto U.S. corn planting progress. Furthermore, the lasting impact of the May report I see as minimal… it’s simply a starting point and largely reinforced what traders already knew.
July Corn Futures Key Pricing Considerations: July corn futures (CN7) closed on Friday (5/12) at $3.71 finishing up a ¼-cent per bushel week-on-week.
Takeaways from this week’s price action:
If there was a mildly supportive surprise for corn futures in the May 2017 WASDE report it was the USDA’s cut to 2017/18 World corn ending stocks, which the USDA estimated at 195.3 MMT versus 223.9 MMT in 2016/17. If realized this would represent a 12.8% reduction in stocks in just one crop year. Most of the decline in ending stocks was attributed to China’s 2017/18 corn carryout falling to 81.3 MMT, down 20.1 MMT from 2016/17. It should be noted that China has continued to work toward reducing its state-owned corn inventories through sales via government auctions. That said I’m not of the opinion at this time that those sales will necessarily correlate into a 20% year-on-year decrease in ending stocks. Therefore as it relates to World corn stocks, I do believe the USDA is currently under-estimating the 2017/18 World corn carryout by at least 5 to 10 MMT.
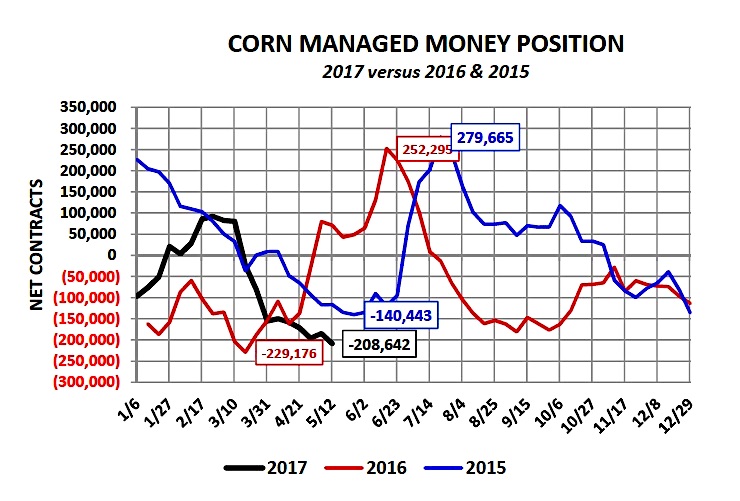
Technically July 2017 corn futures remain very much range bound from approximately $3.60 to $3.80. Recent notable day highs providing topside resistance have all been from $3.79 to $3.79 ½ (on 4/3, 4/13, and 5/1). Furthermore the 61.8% Fibonacci retracement at $3.811 is also right above that area, which should act as a stopper on even small continuation rallies over the short-term. On the downside recent notable day lows providing price support on even minor price breaks range from $3.65 to $3.60 ¾ (on 4/21, 4/28, and 5/8). Friday’s Commitment of Traders report showed the Managed Money net corn short increasing to -208,642 contracts. Given the higher weekly close this should be viewed as mildly supportive early next week.
Thanks for reading.
Twitter: @MarcusLudtke
Author hedges corn futures and may have a position at the time of publication. Any opinions expressed herein are solely those of the author, and do not in any way represent the views or opinions of any other person or entity.
Data References:
- USDA United States Department of Ag
- EIA Energy Information Association
- NASS National Agricultural Statistics Service


