March corn futures closed up 7 cents last week, finishing at $3.83.
With the new year upon us, corn traders are starting fresh and beginning to look ahead. Let’s review key news and trends in the market as we approach the new year.
South American Soybean Production Update:Earlier this week there was a report released by a notable South American crop analyst who began trimming his production estimate for Brazil’s 2018/19 soybean crop, lowering it to 119.0 MMT.
A dryer weather pattern has persisted in Brazil throughout the month of December, affecting several key soybean producing states such Parana, Mato Grosso, and Mato Grosso do Sul. The belief is that the hot and dry temperatures have caused an acceleration in soybean maturities, resulting in smaller seeds and in some cases significant yield losses. In the December 2018 WASDE report the USDA estimated 2018/19 Brazil soybean production at 122.0 MMT. Therefore the trade will be monitoring closely the January 2019 WASDE report (released on 1/11/19) to see if the USDA makes any negative adjustments to its Brazilian soybean production forecast.
China Manufacturing Data: Recently released data (the Caixin General Manufacturing PMI) for the month of December showed China’s manufacturing sector contracting for the first time since May 2017.
It is believed that the Trump Administration’s tariffs on Chinese goods has played a significant role in the deteriorating health of China’s economy (China’s GDP was 6.5% in the 3rdquarter of 2018; the weakest it’s been since the global financial crisis). Will this then finally force China to capitulate in its trade war with the U.S.? Obviously much is still to be decided with both countries rumored to be in ongoing negotiations; however I’m hoping this is the “incentive” China needs to seek an accelerated compromise.
In 2019 U.S. farmers, and specifically U.S. soybean farmers, need unrestricted access to China’s markets to help solve for record high U.S. soybean endings stocks of 955 million bushels. There remains no alternative global replacement for China’s soybean import demand, which accounts for approximately 60% of total World soybean imports.
U.S. Government Shutdown: For Ag traders the government shutdown continues to have a substantial impact on market transparency.
Why? The USDA and the National Agricultural Statistics Service remain out of commission as it relates to releasing updated trade reports. The USDA’s website has issued this statement, “This website will not be updated during a lapse in federal funding. Content on this website will not be current or maintained until funding issues have been resolved.” What this means then is the market isn’t receiving any daily, weekly, or monthly U.S. export sales data.
Additionally there will be no January 2019 WASDE report or Crop Production report released next week unless the U.S. government reopens. Therefore traders have essentially been relying on physical cash movement (PNW basis fluctuations) to try and discern whether or not China, for example, has been back in buying U.S. soybeans. Obviously this is not ideal…especially given the magnitude of the January reports as it relates to the USDA finalizing the 2018/19 U.S. corn and soybean yields. Futures values need to be able to respond to accurate, real-time S&D adjustments…that can’t happen with the U.S. government shutdown.
NEW CROP SOYBEAN (SX9) / CORN (CZ9) PRICE RATIO:
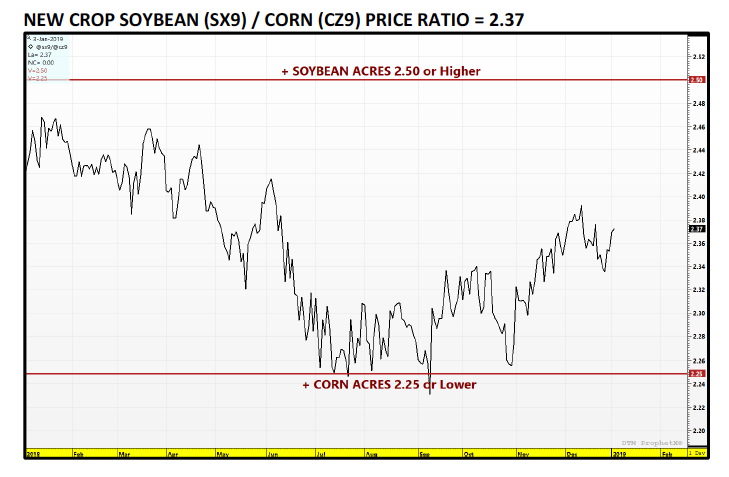
- Traditionally to add significant soybean acres this ratio needs to trade between 2.50 to 2.60 from Dec – Mar (or higher). For example in 2017 U.S. soybean acreage expanded +6.7 million acres from the previous crop year. That year the SX2017/CZ2017 price ratio traded as high as 2.70 from Dec 2016 – Mar 2017, and didn’t trade below 2.50 until 3/31/17. The economics clearly favored adding soybean acres at the expense of corn in 2017.
- Conversely to add significant corn acres this ratio needs to trade at or below 2.25. For example in 2016 U.S. corn acreage expanded +5.98 million acres from the previous crop year. That year the SX2016/CZ2016 price ratio traded as low as 2.22 on 12/15/2015 and traded below 2.35 into the first week of March 2016. The economics clearly favored adding corn acres at the expense of soybeans in 2016.
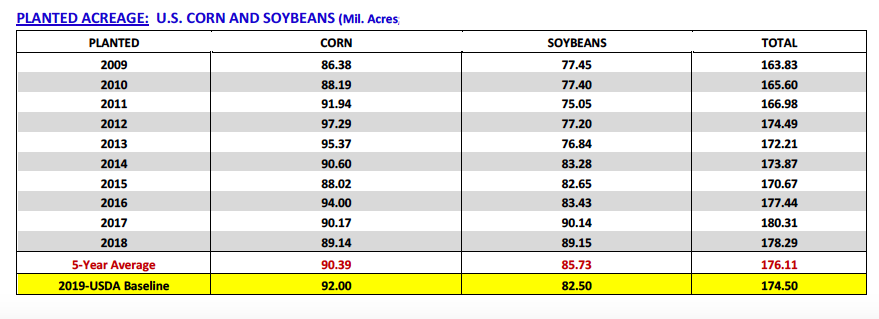
- The USDA in its Baseline 2019/20 U.S. S&D forecasts estimated 2019 U.S. corn planted acreage of 92.0 million acres, +2.86 million acres versus 2018. They projected 2019 U.S. soybeans planted acreage of 82.50 million acres, -6.65 million acres versus 2018. Does the current SX2019/CZ2019 price ratio support this type of acreage switching (more corn acres and substantially less soybean acres)?At present (ratio = 2.37)…I would argue the price ratio does support adding some corn acres in 2019; however I don’t think its decisive and I certainly don’t believe it justifies losing 6.7 million soybean acres crop year-on-year. This then means either CZ19 corn futures are undervalued or SX19 soybean futures are overvalued. To push the SX19/CZ19 ratio to decidedly more corn acres (ratio of 2.25)…CZ19 would need to rally to approximately $4.25 per bushel versus a $9.57 SX19 futures prices (current value).
U.S. Corn Futures Trading Weekly Outlook:
Corn futures ended on a positive note Friday with the market finding decent support heading into the weekend despite the USDA announcing earlier that morning that the January WASDE report would in fact be delayed due to the continued U.S. government shutdown. No revised release date was given (original date = 1/11/2019).
However China’s Commerce Ministry also confirmed on Friday that trade talks with the U.S. would restart in Beijing on January 7-8th. This no doubt helped spur gains in corn and soybean futures with Ag Bulls optimistic that China could look to possibly announce additional U.S. soybean purchases in advance of those trade/tariff talks. There has also been speculation that a Chinese – U.S. corn buy could be in the offing.
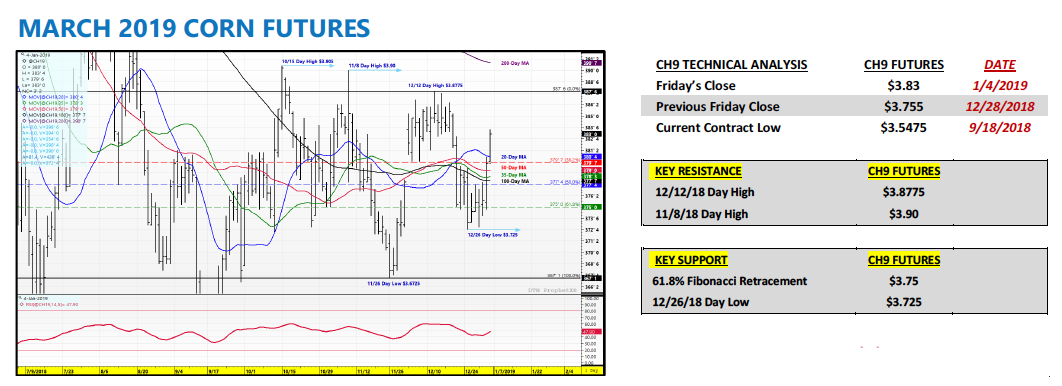
Technical price action in March corn futures was impressive to end the week with CH19 building on Thursday’s close over key price resistance (100 and 50-day moving averages). Based on Friday’s firm close a continuation rally up to $3.88 to $3.90 seems possible heading into next week. Recent notable day highs and potential upside price targets include $3.87 ¾ (12/12), $3.90 (11/8), and $3.90 ½ (10/15). I’d be a scale-in seller above $3.90 CH19 on this wave higher if the opportunity presents itself.
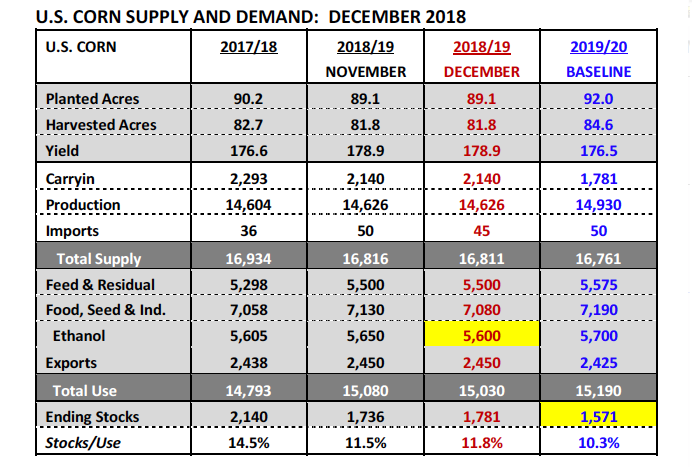
Long-term I still believe corn futures can and will trade higher from current levels. That said the one short-term negative I see is a visible, tangible slowdown in U.S ethanol production. The most recent weekly EIA report showed U.S. ethanol production dipping to 1.011 MMbpd, down from 1.042 MMbpd the previous week and the 4-week average of 1.036 MMbpd. Clearly ethanol producers are starting to react to highly negative industry-wide plant margins by cutting production capacity. This could force the USDA to lower its U.S. corn-ethanol demand forecast of 5.600 billion bushels in either Jan/Feb WASDE reports…
Twitter: @MarcusLudtke
Author hedges corn futures and may have a position at the time of publication. Any opinions expressed herein are solely those of the author, and do not in any way represent the views or opinions of any other person or entity.
Data References:
- USDA United States Department of Ag
- EIA Energy Information Association
- NASS National Agricultural Statistics Service

: Worrisome to Broader Market?")


